A Statistical Analysis of Top Marvel Rivals Players
Introduction
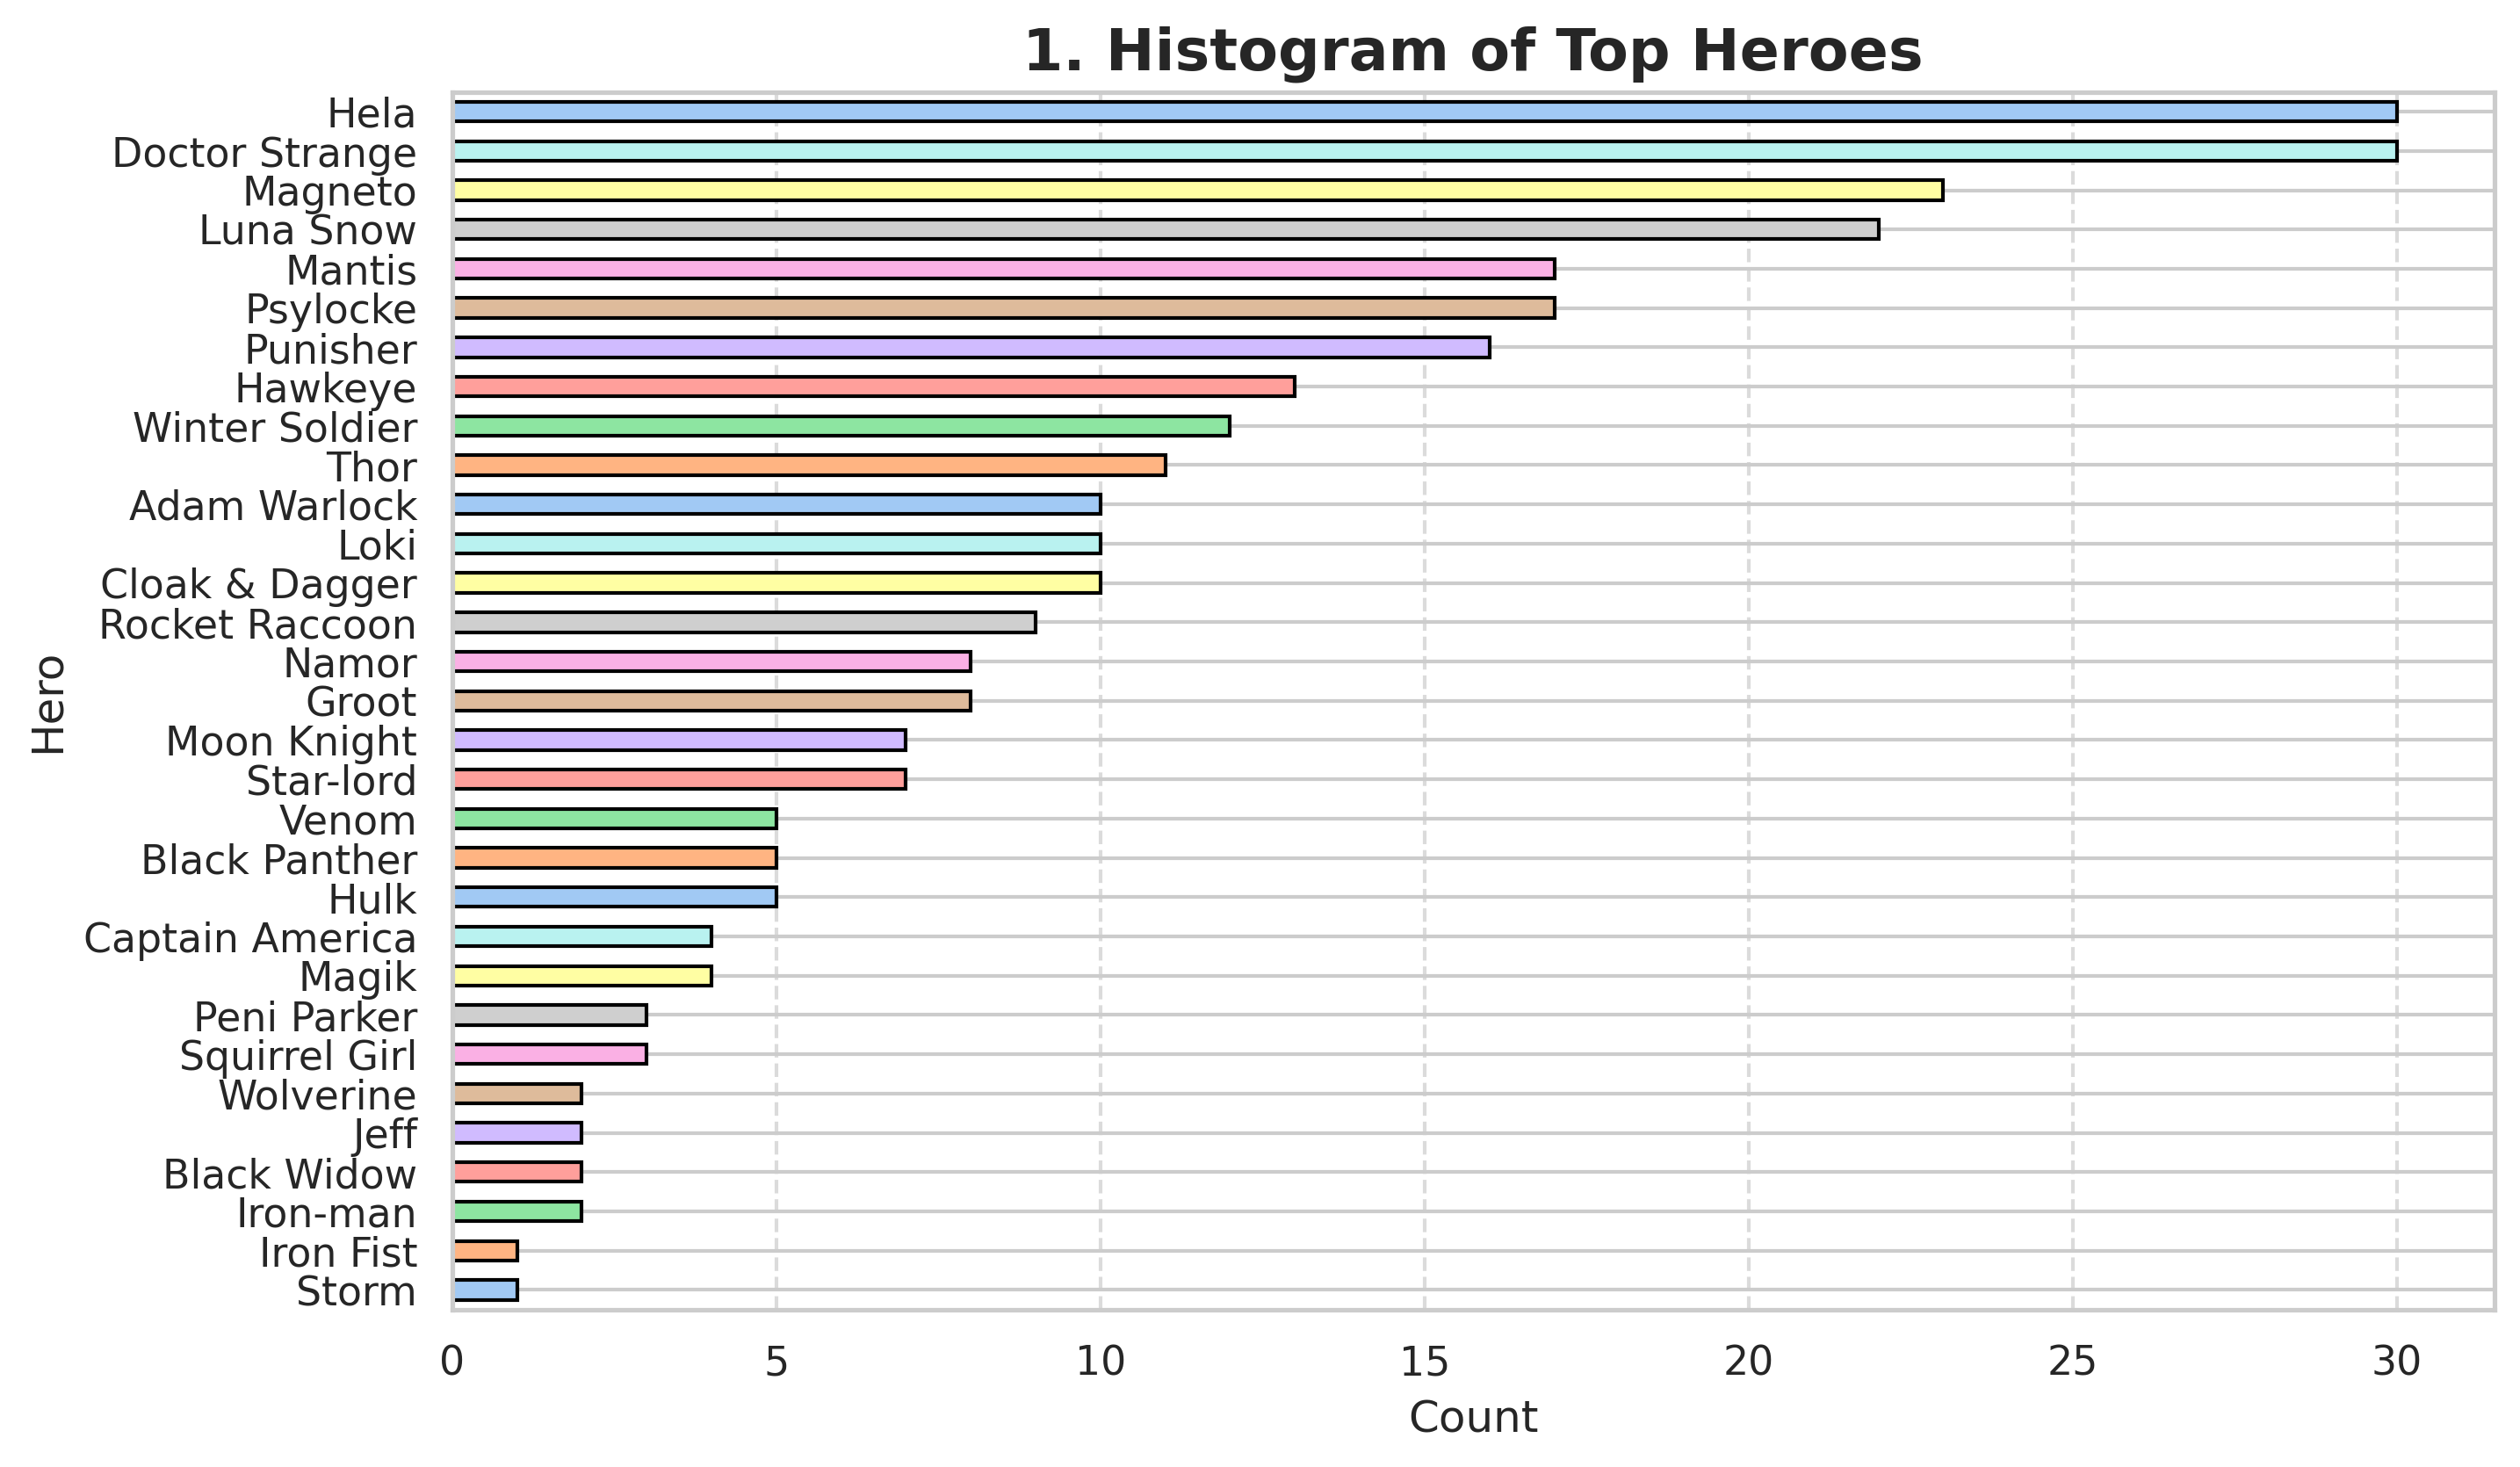
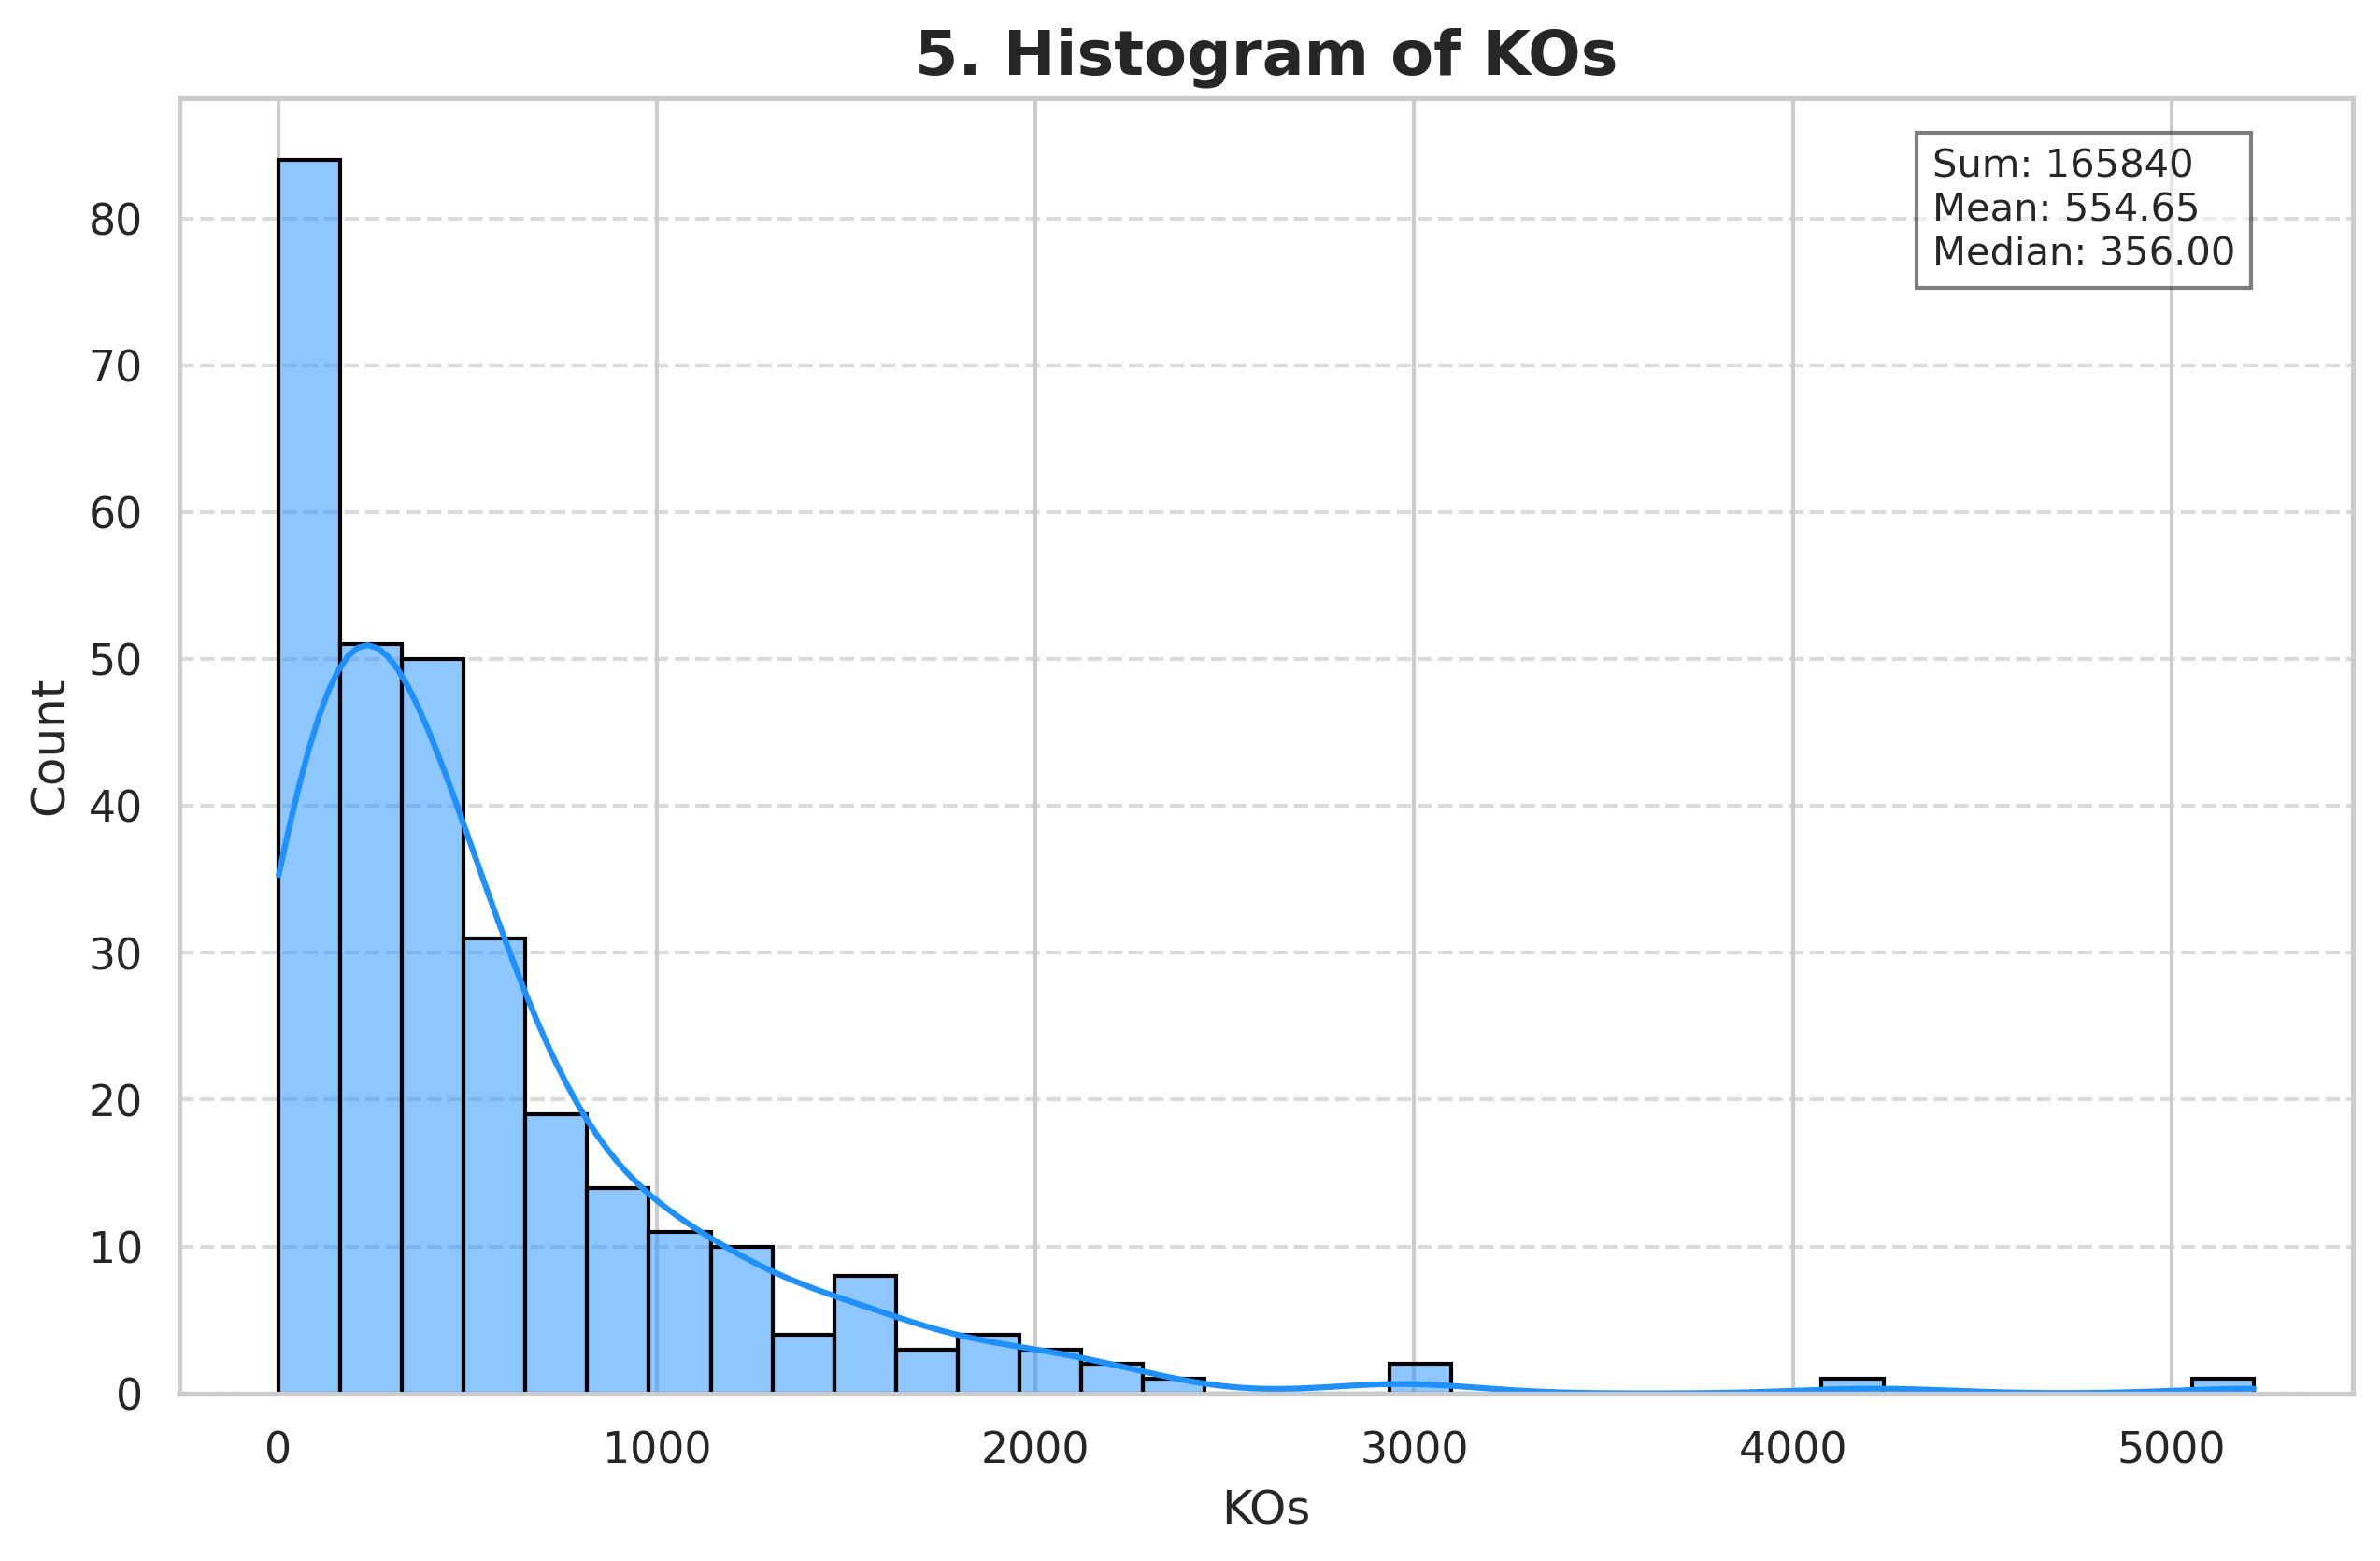
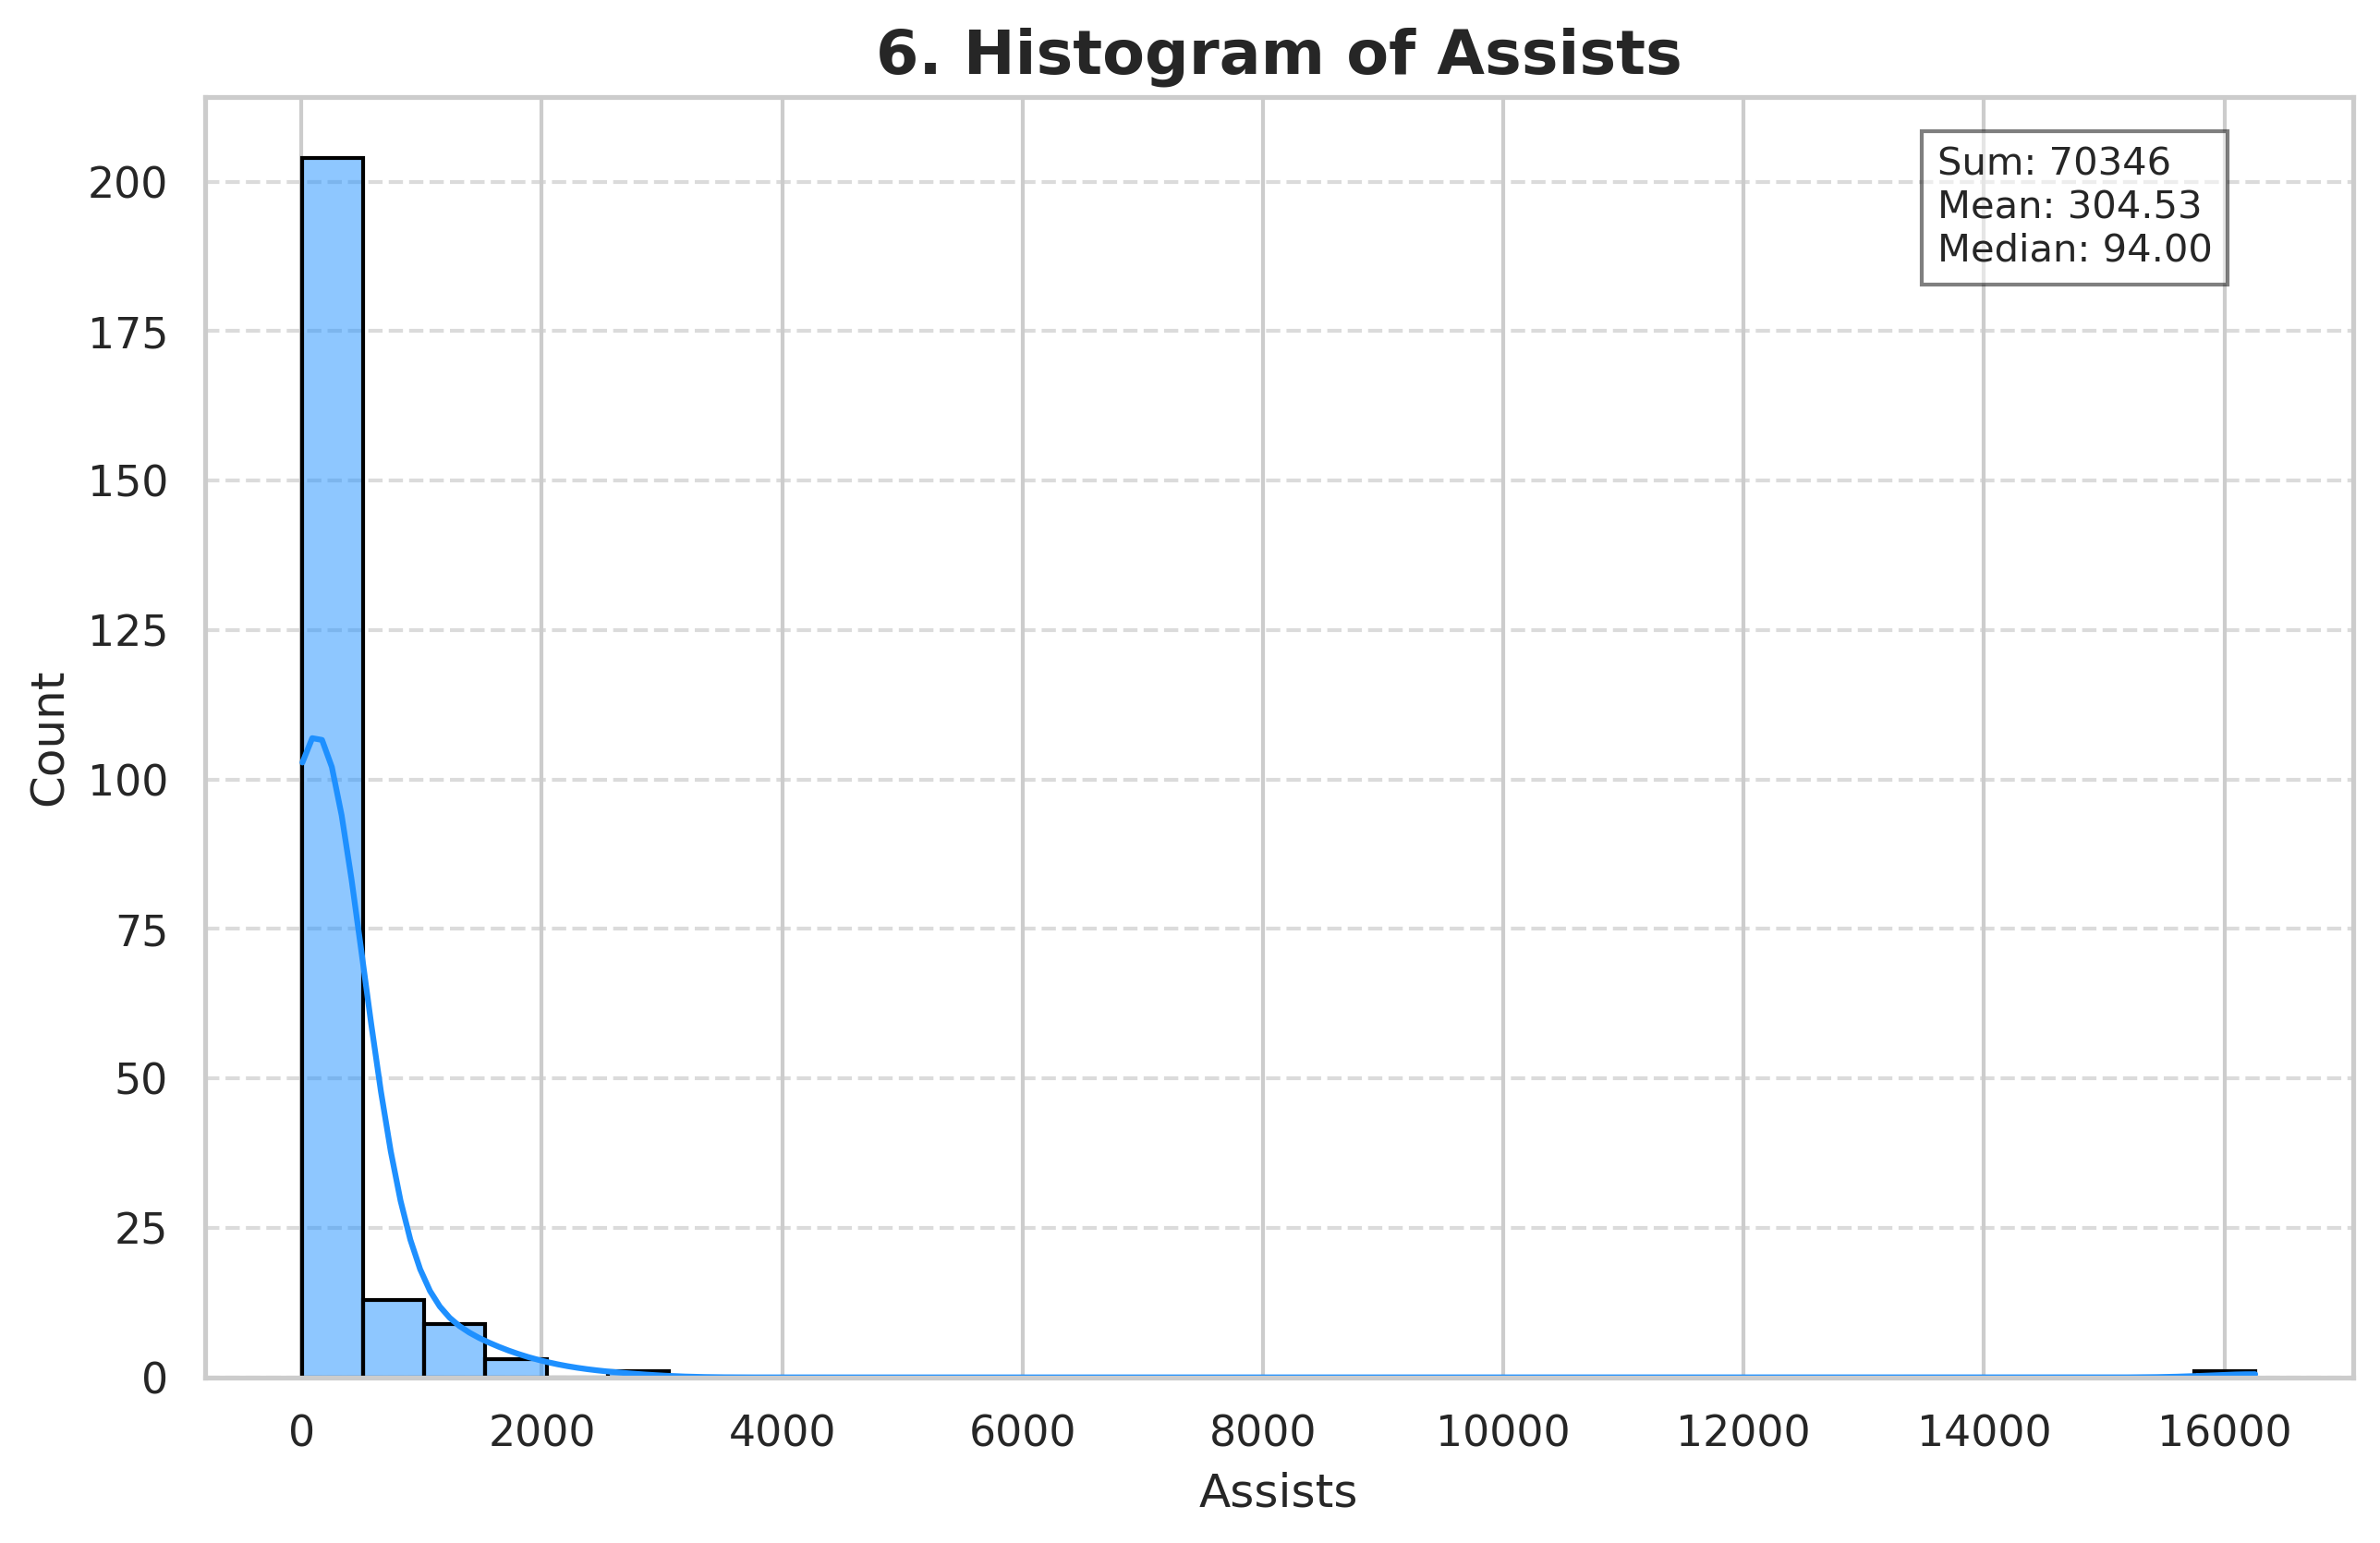
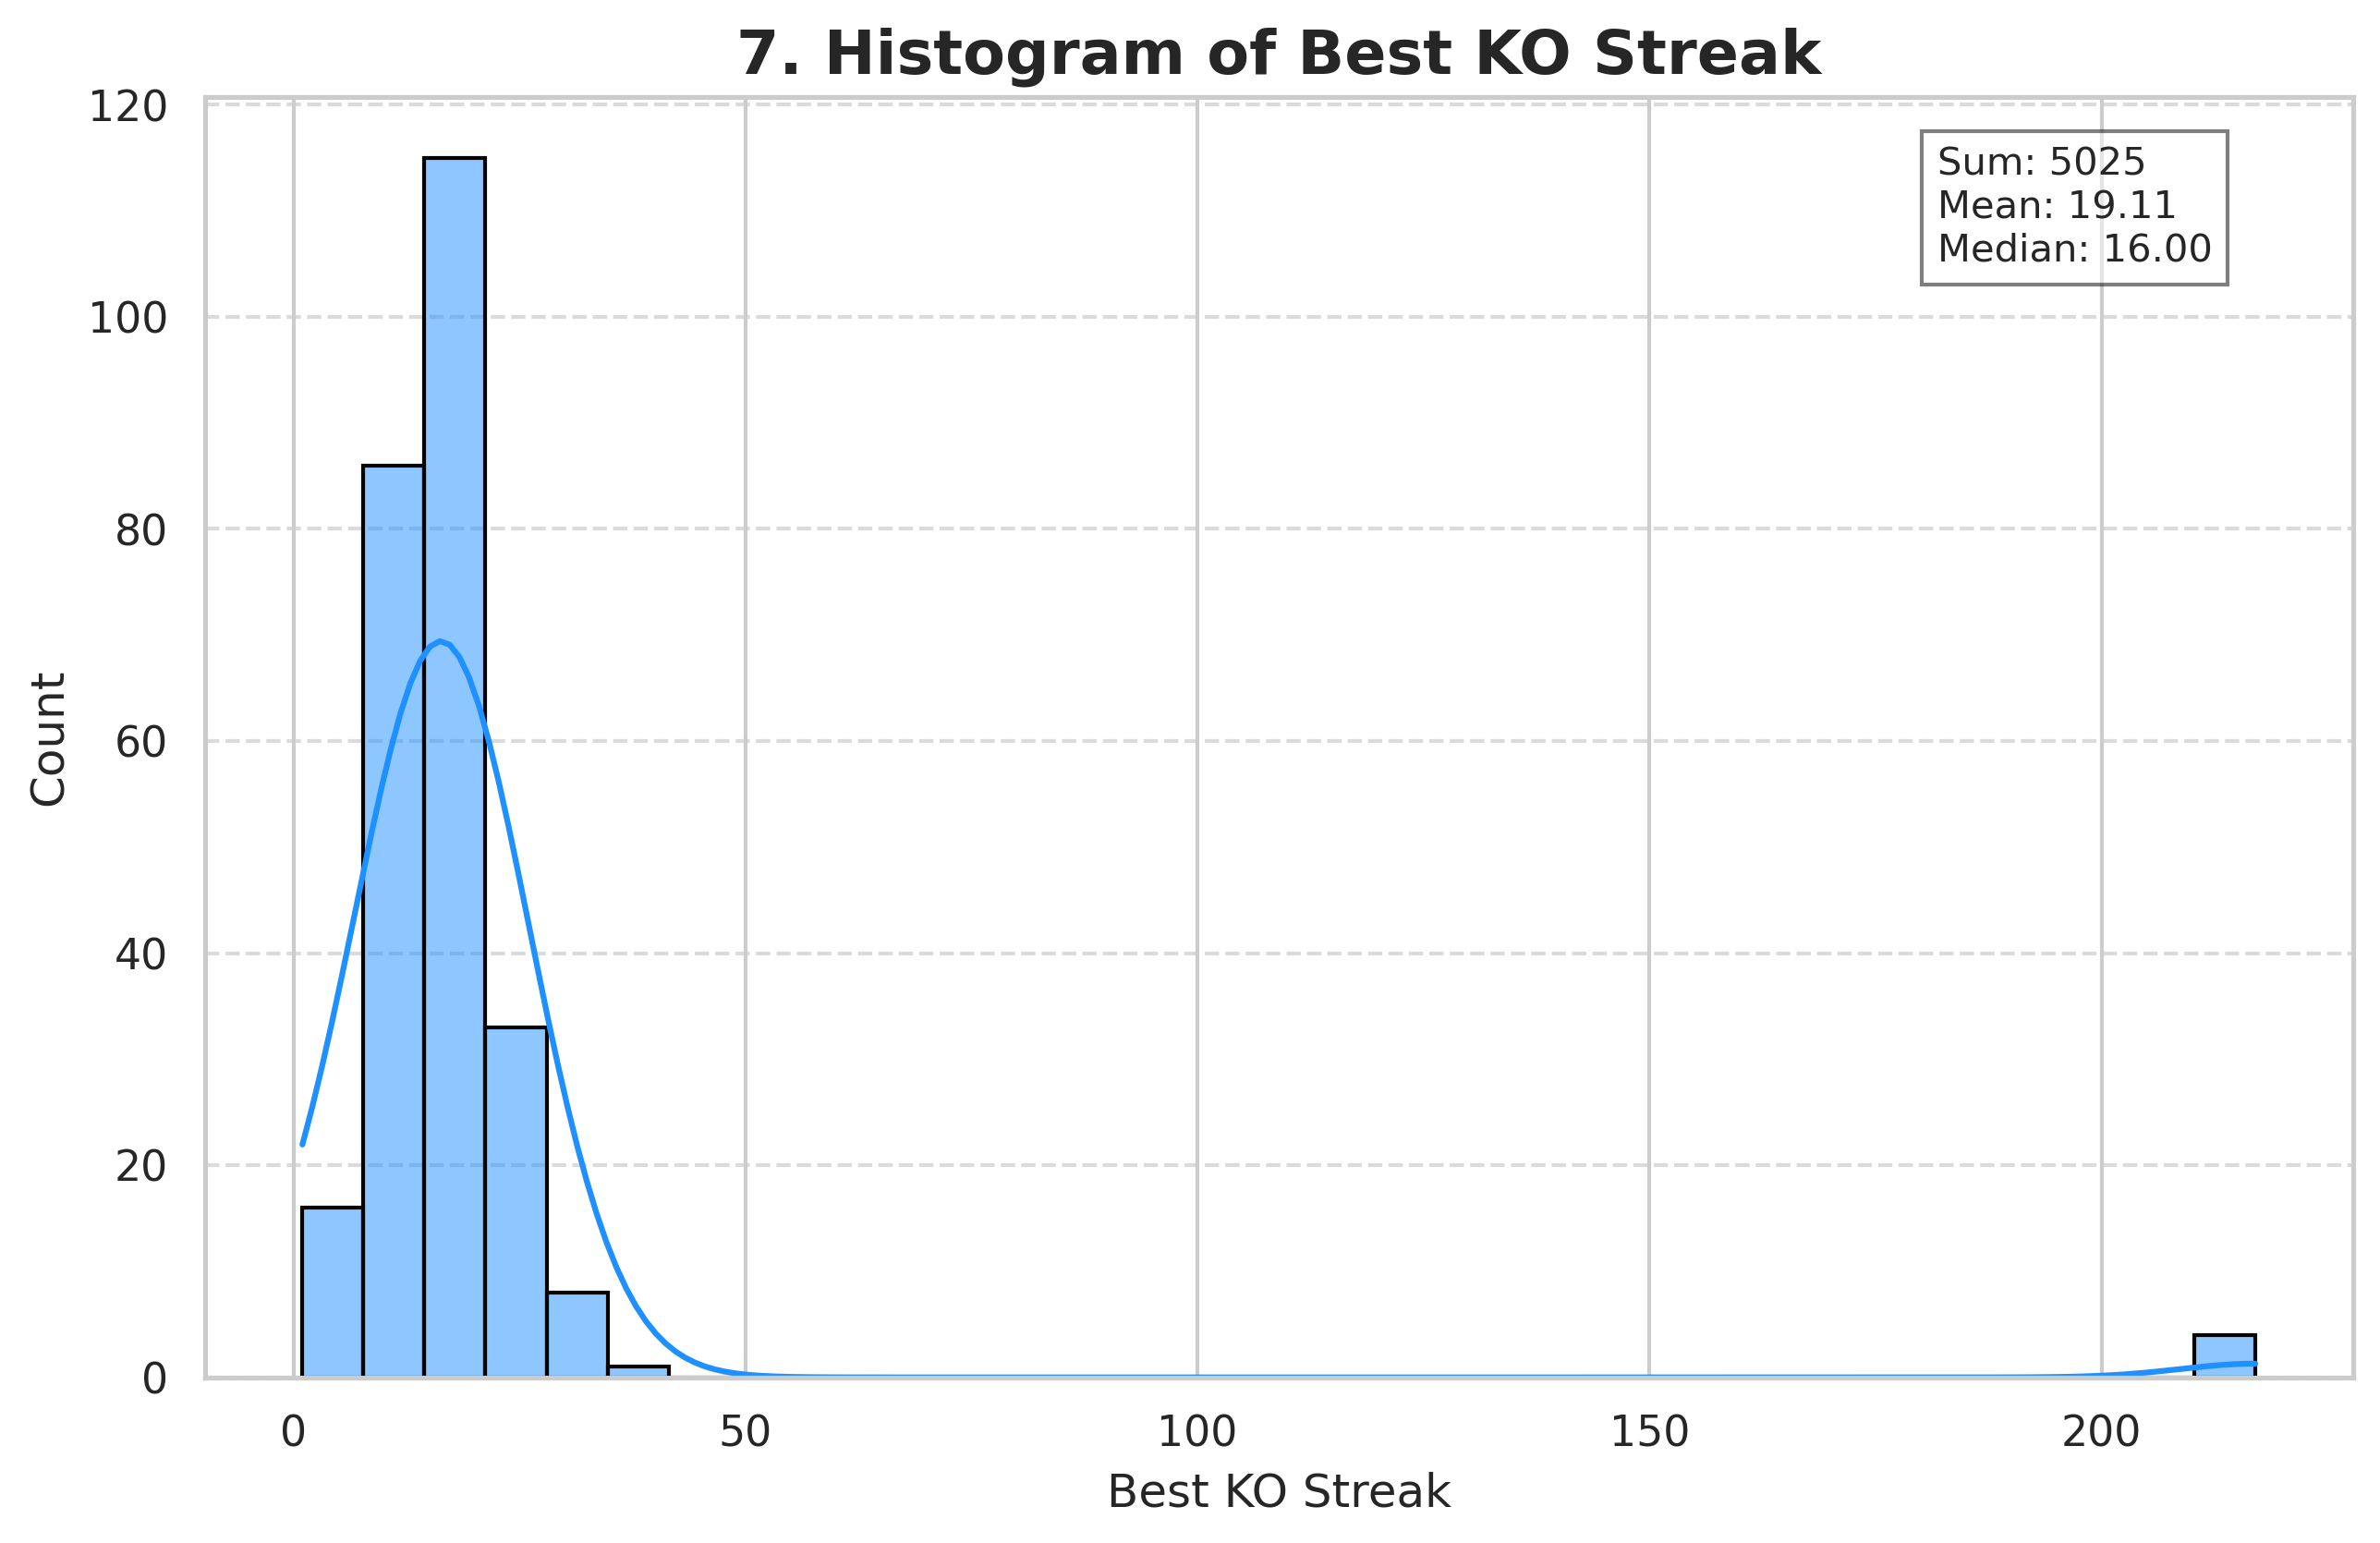
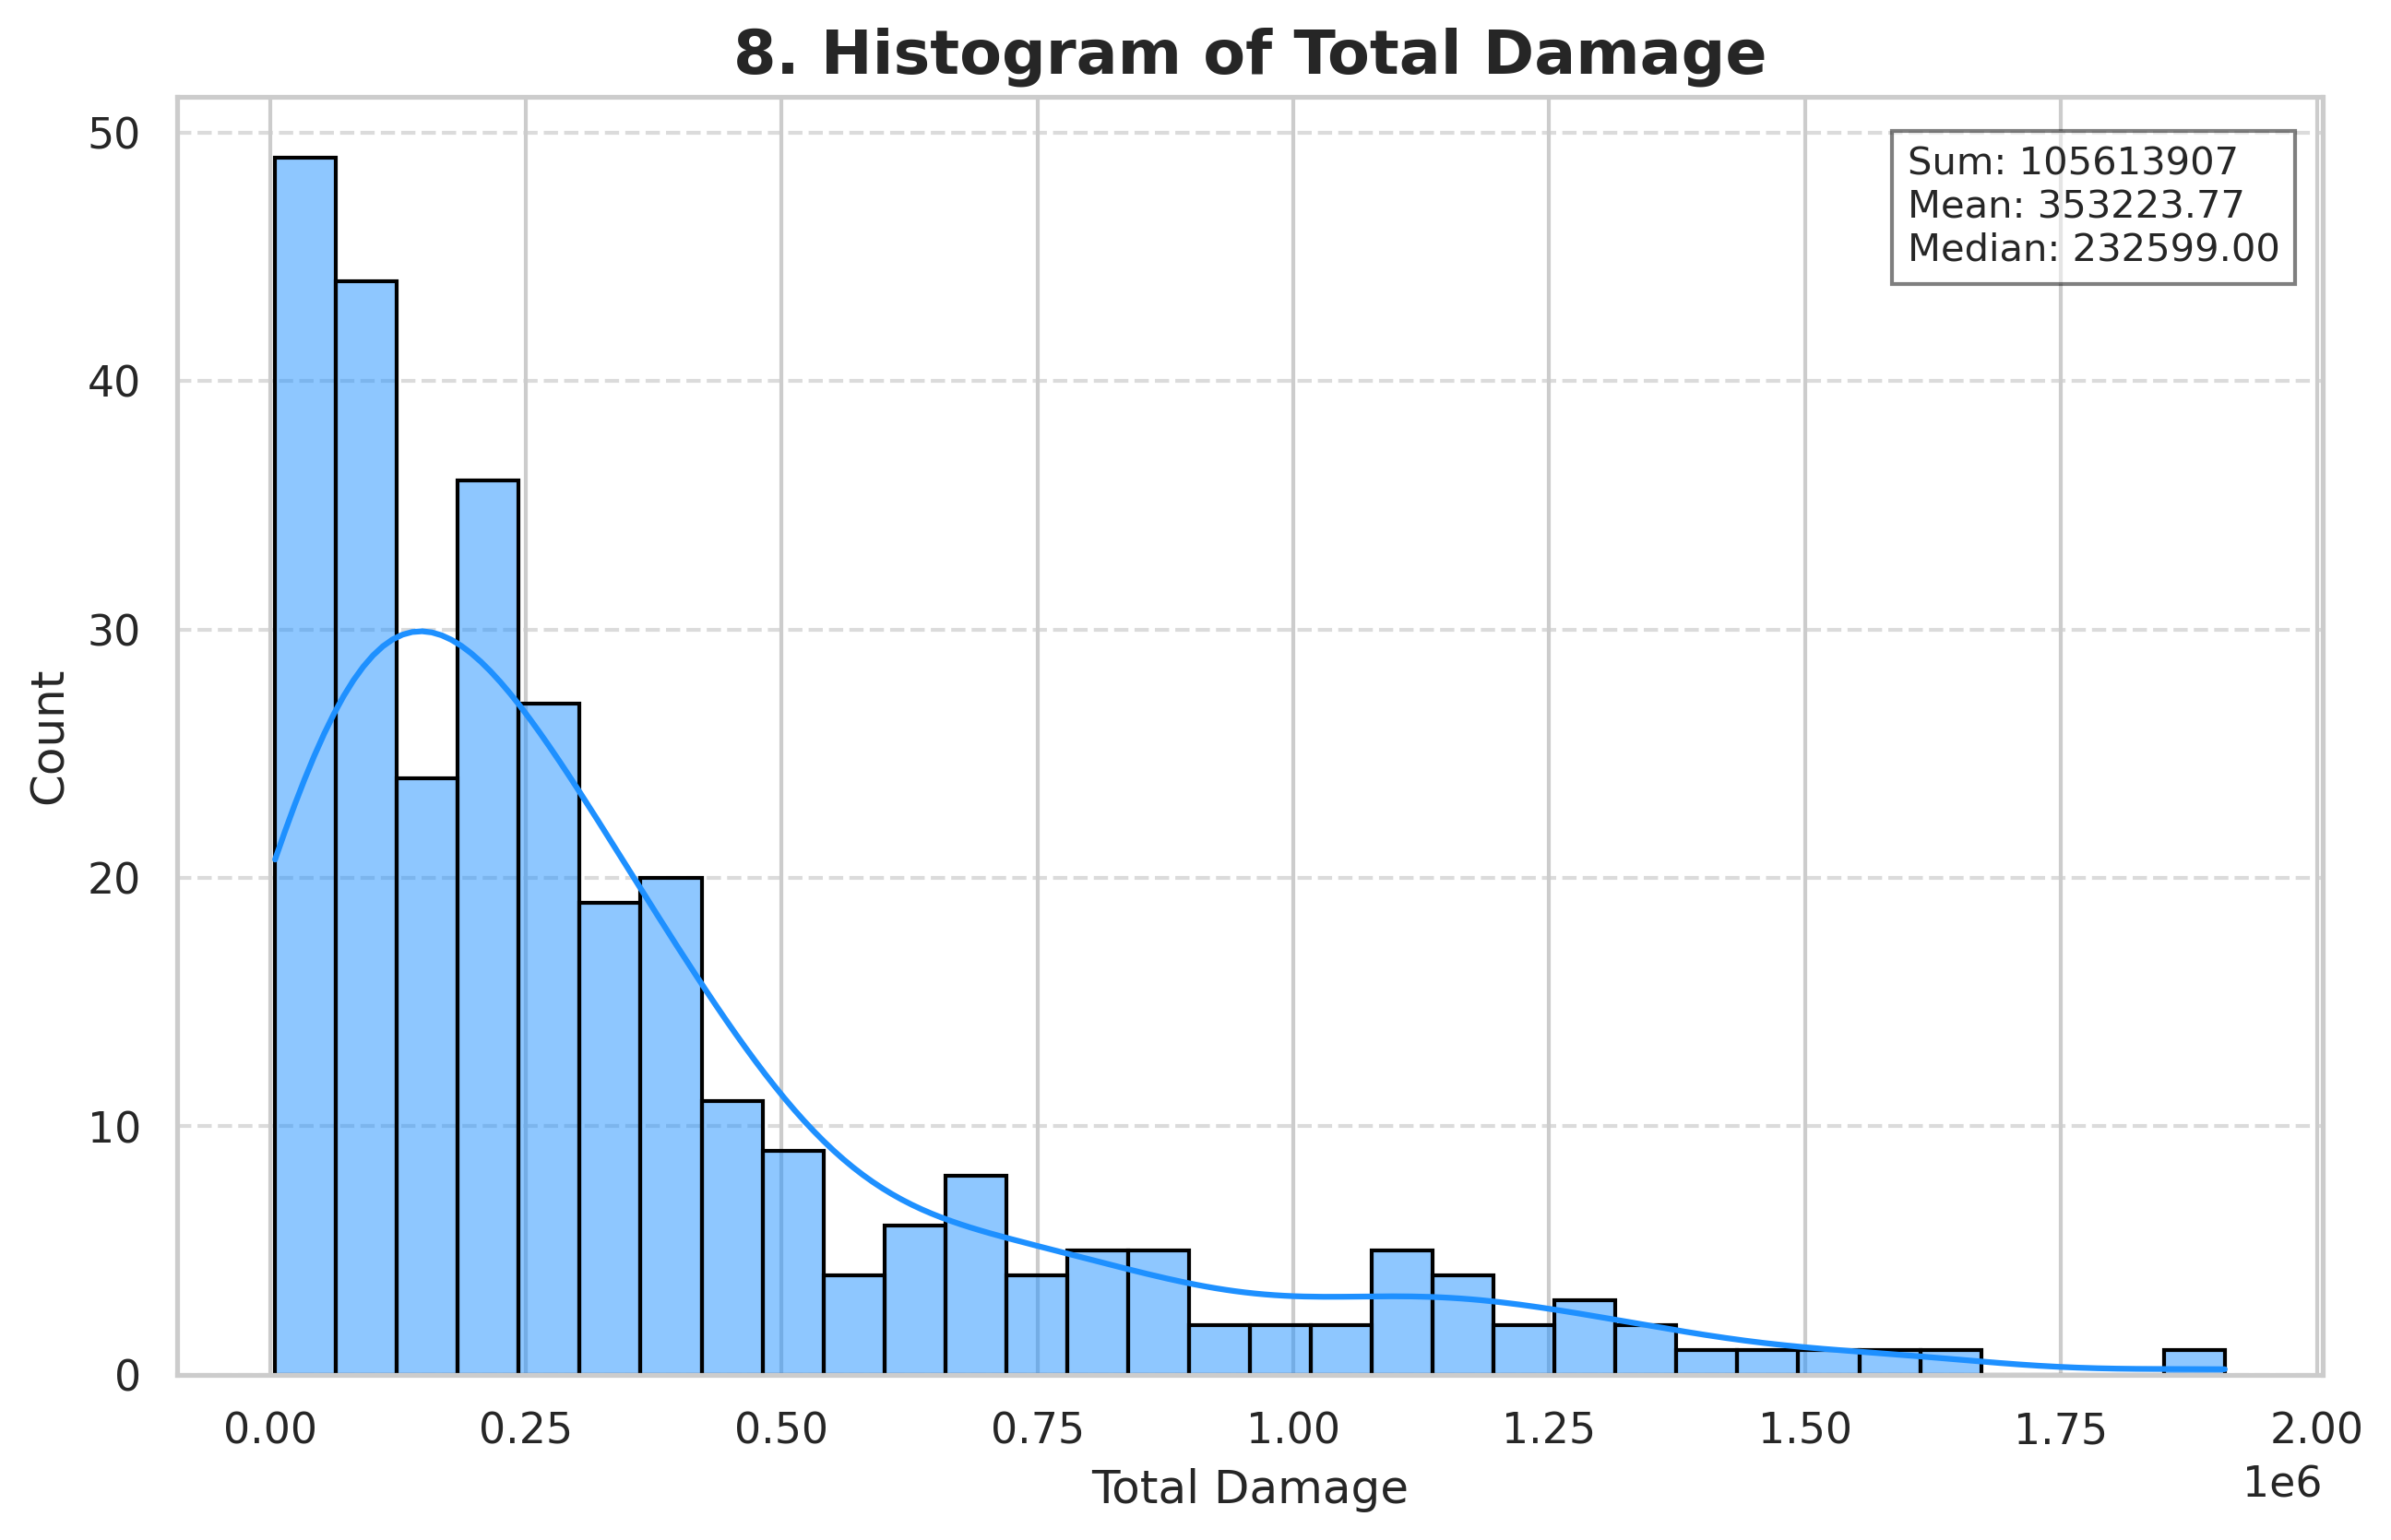
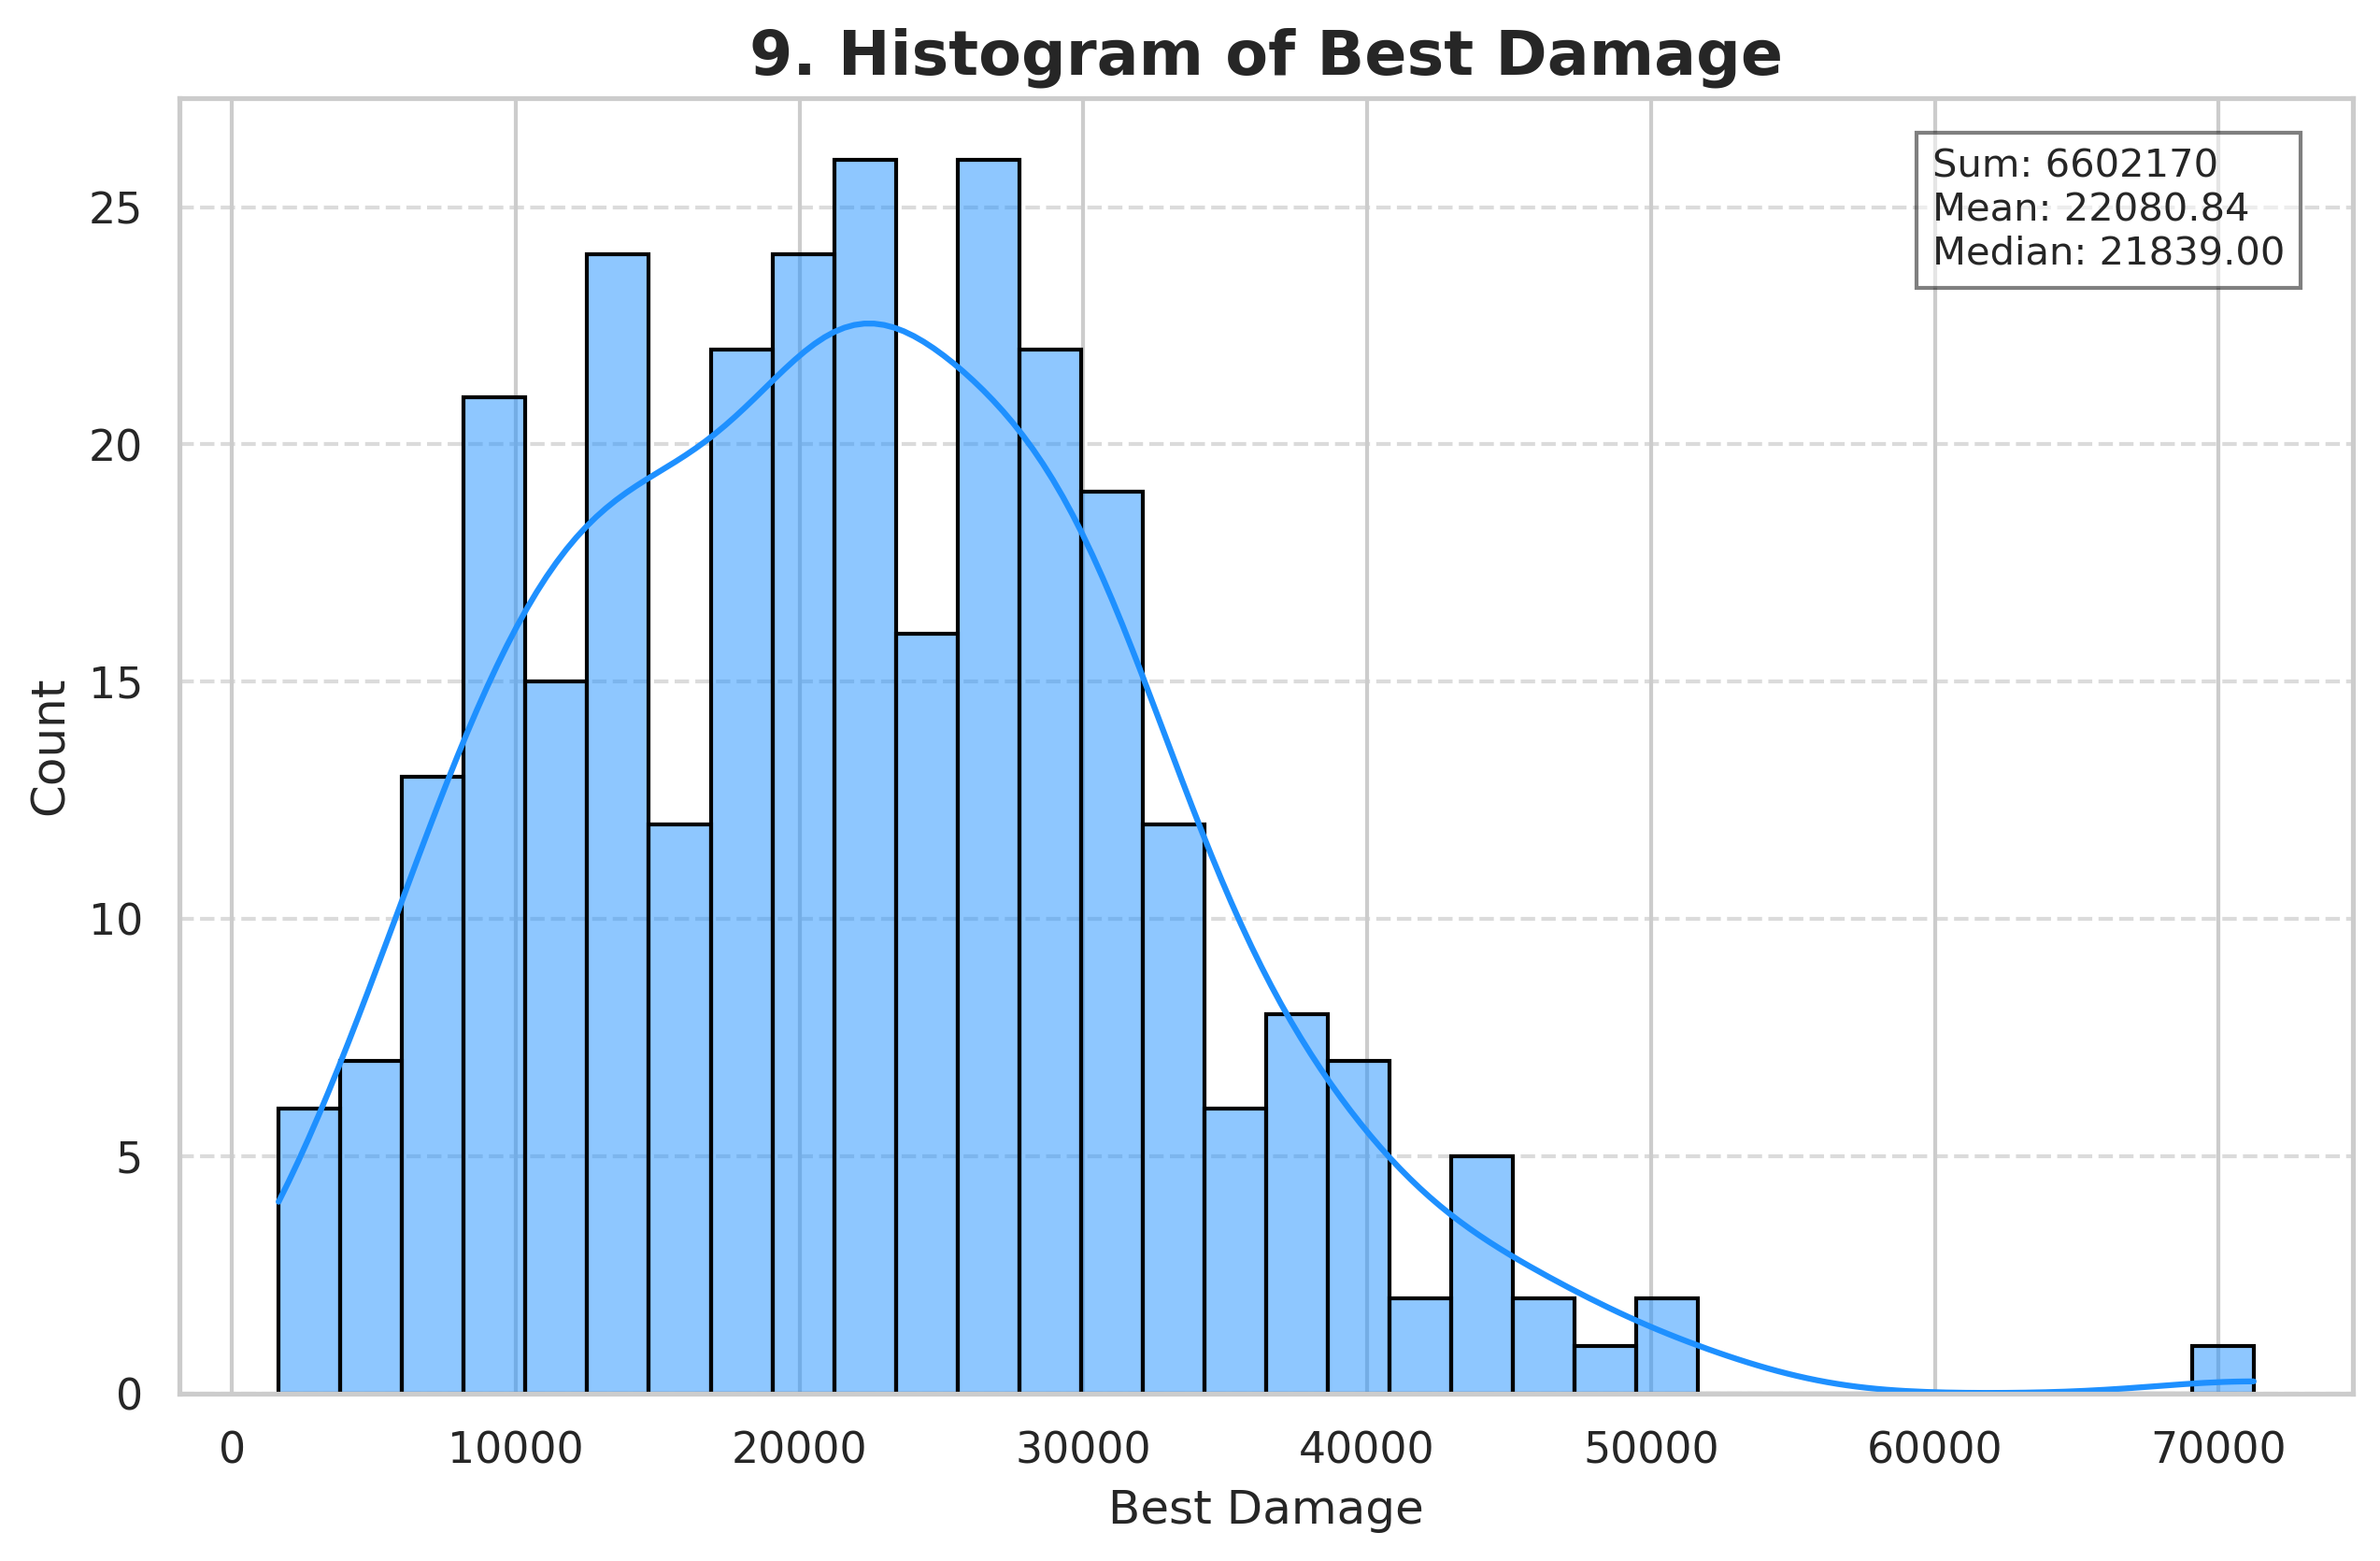
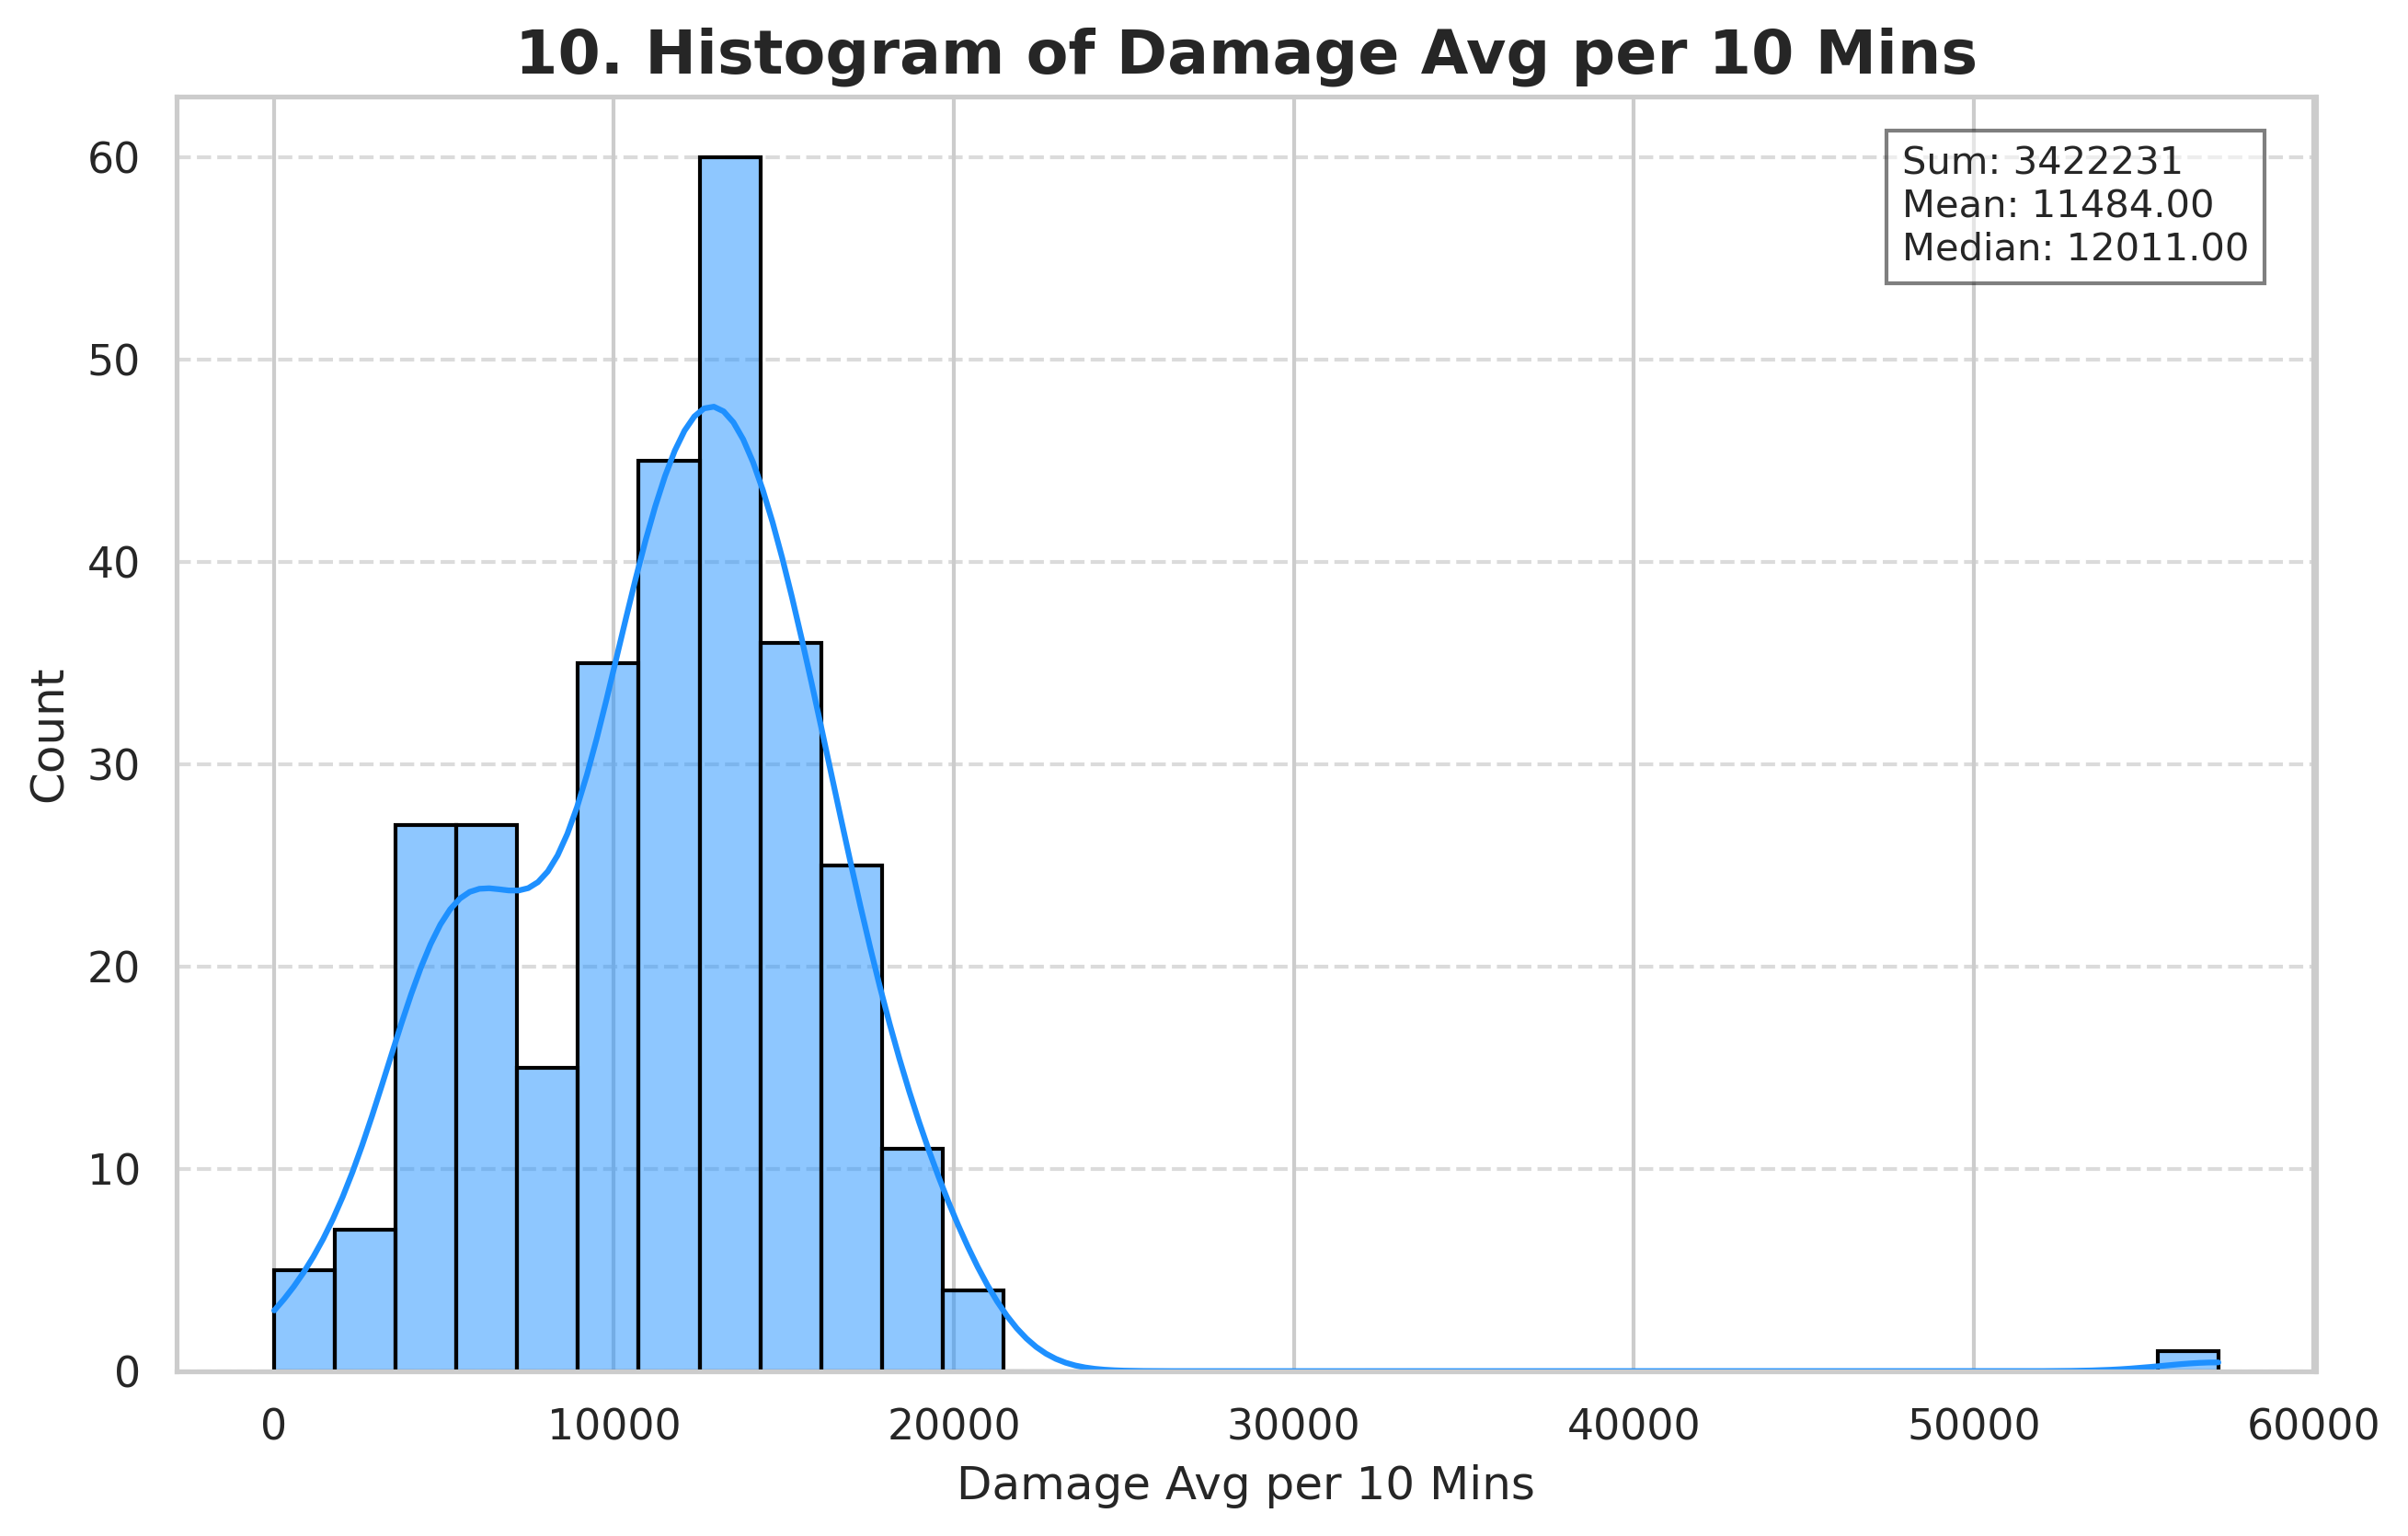
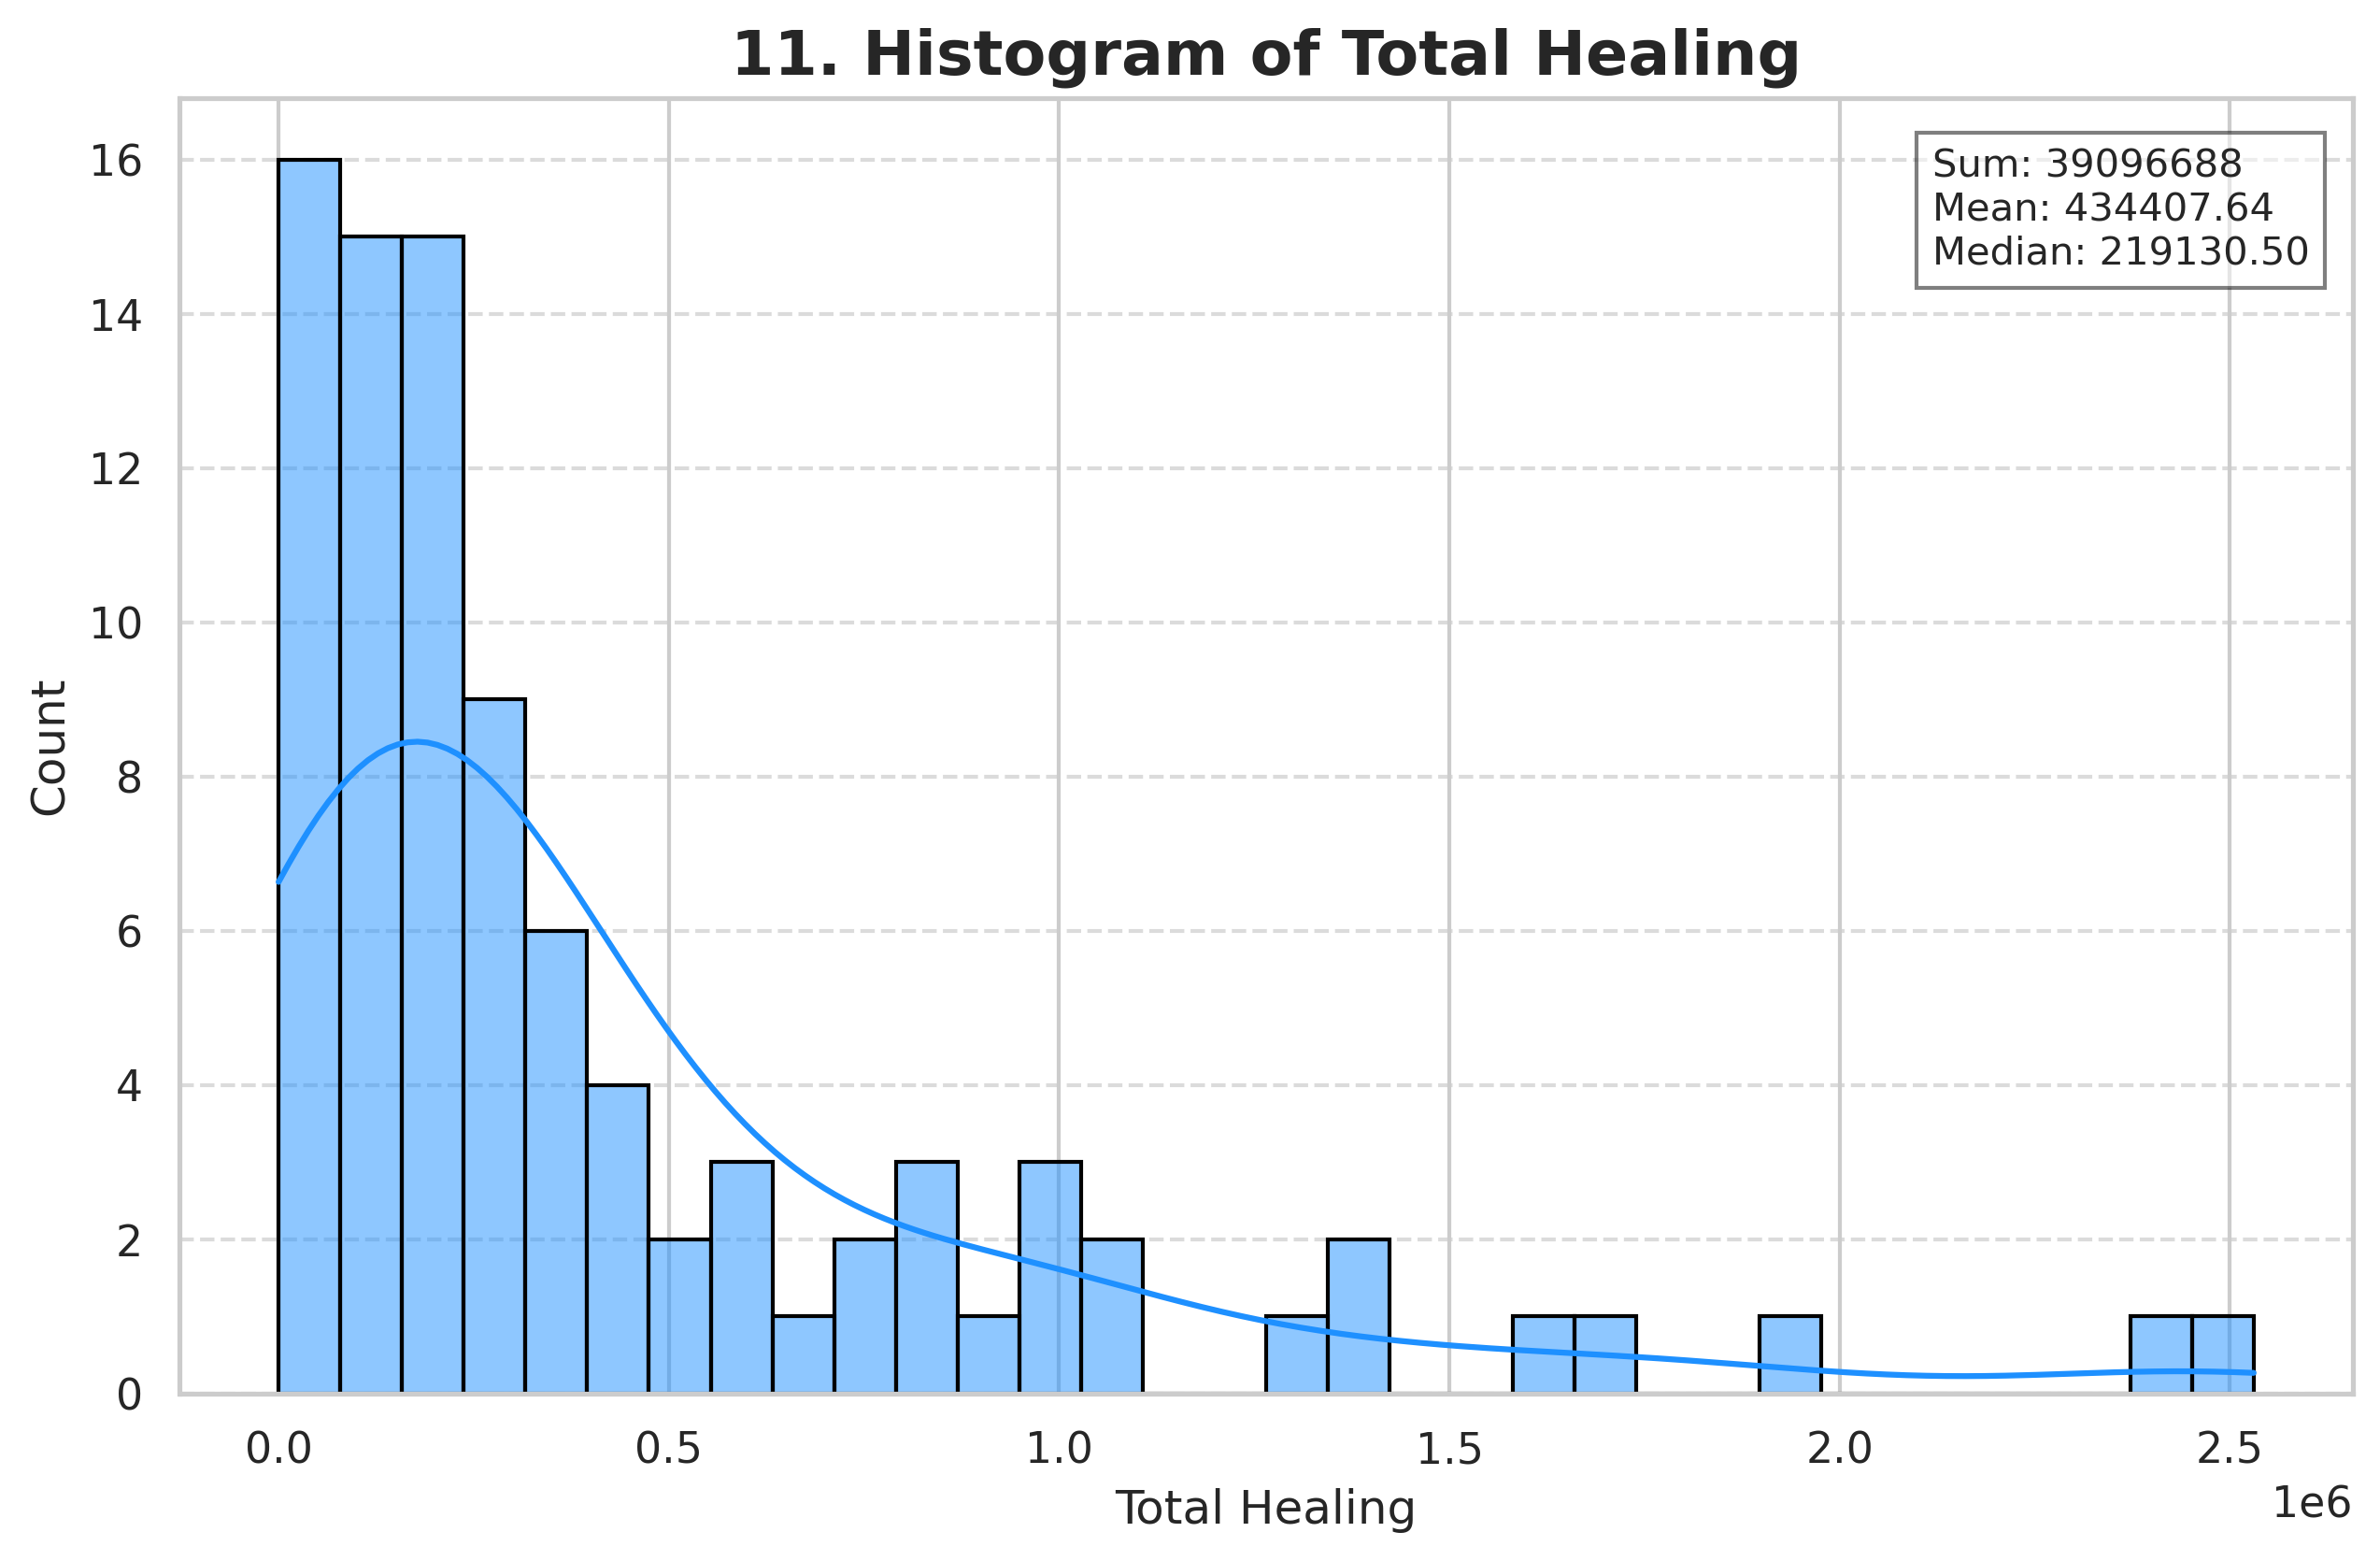
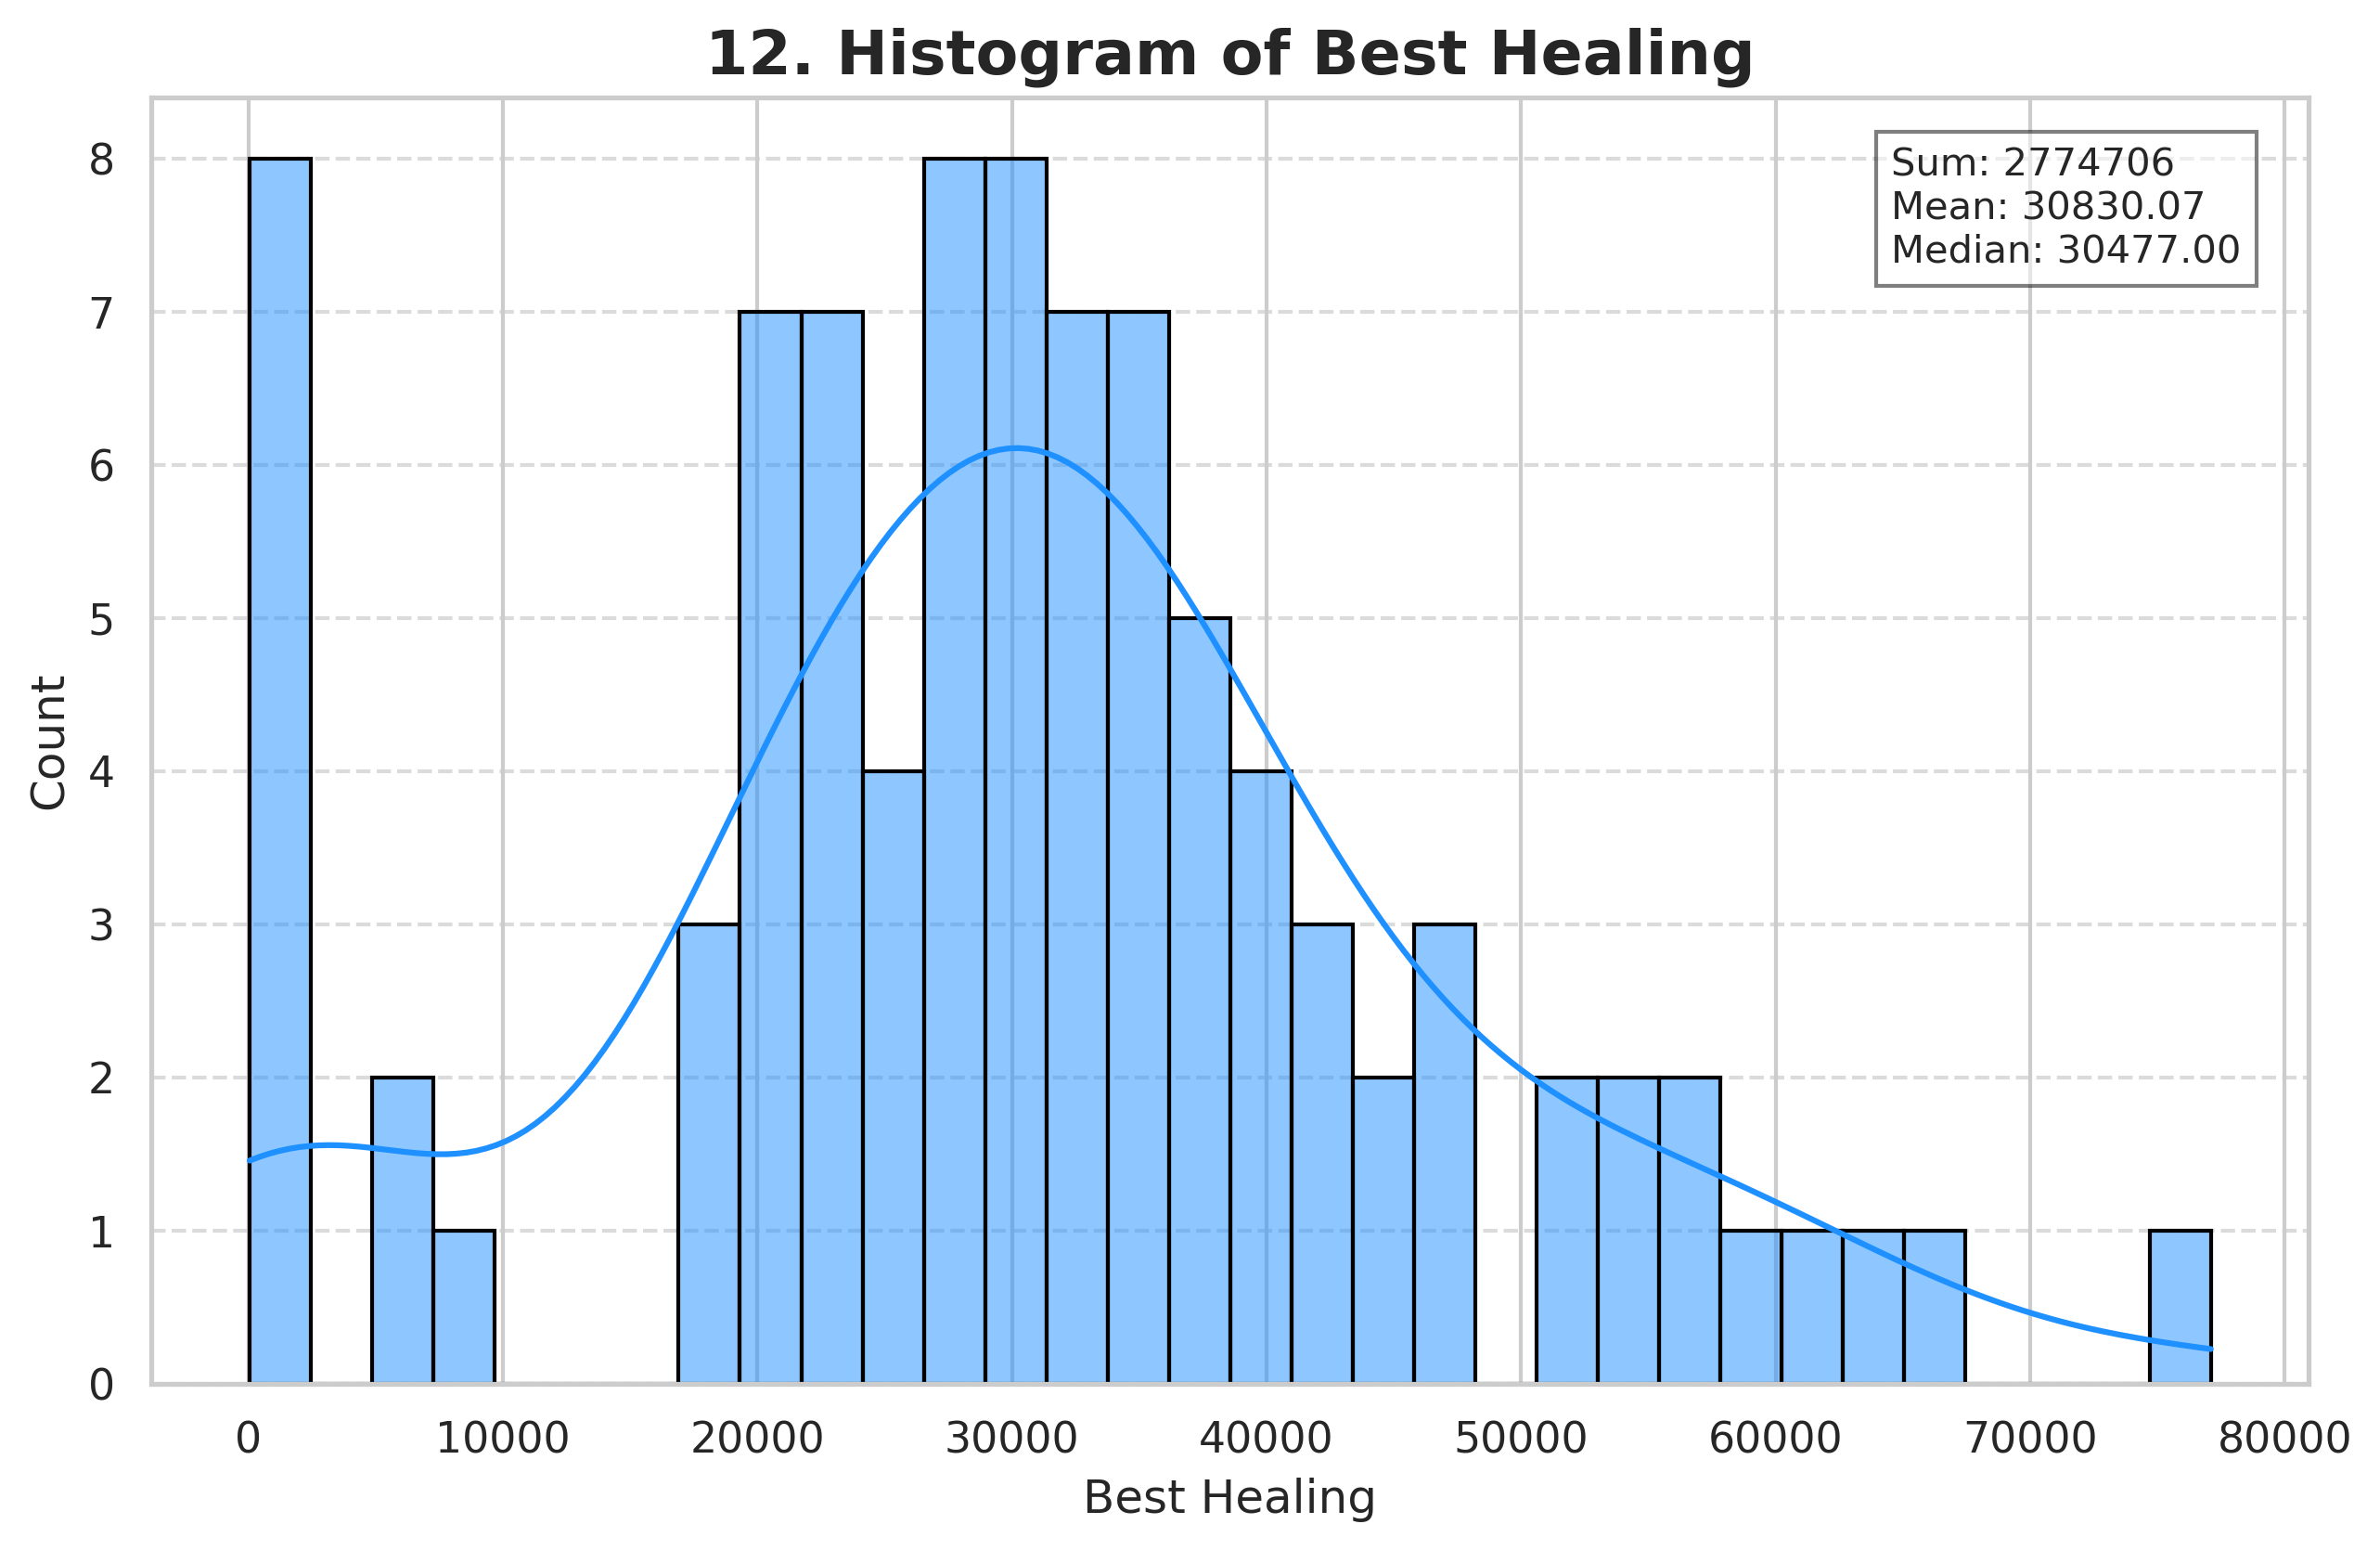
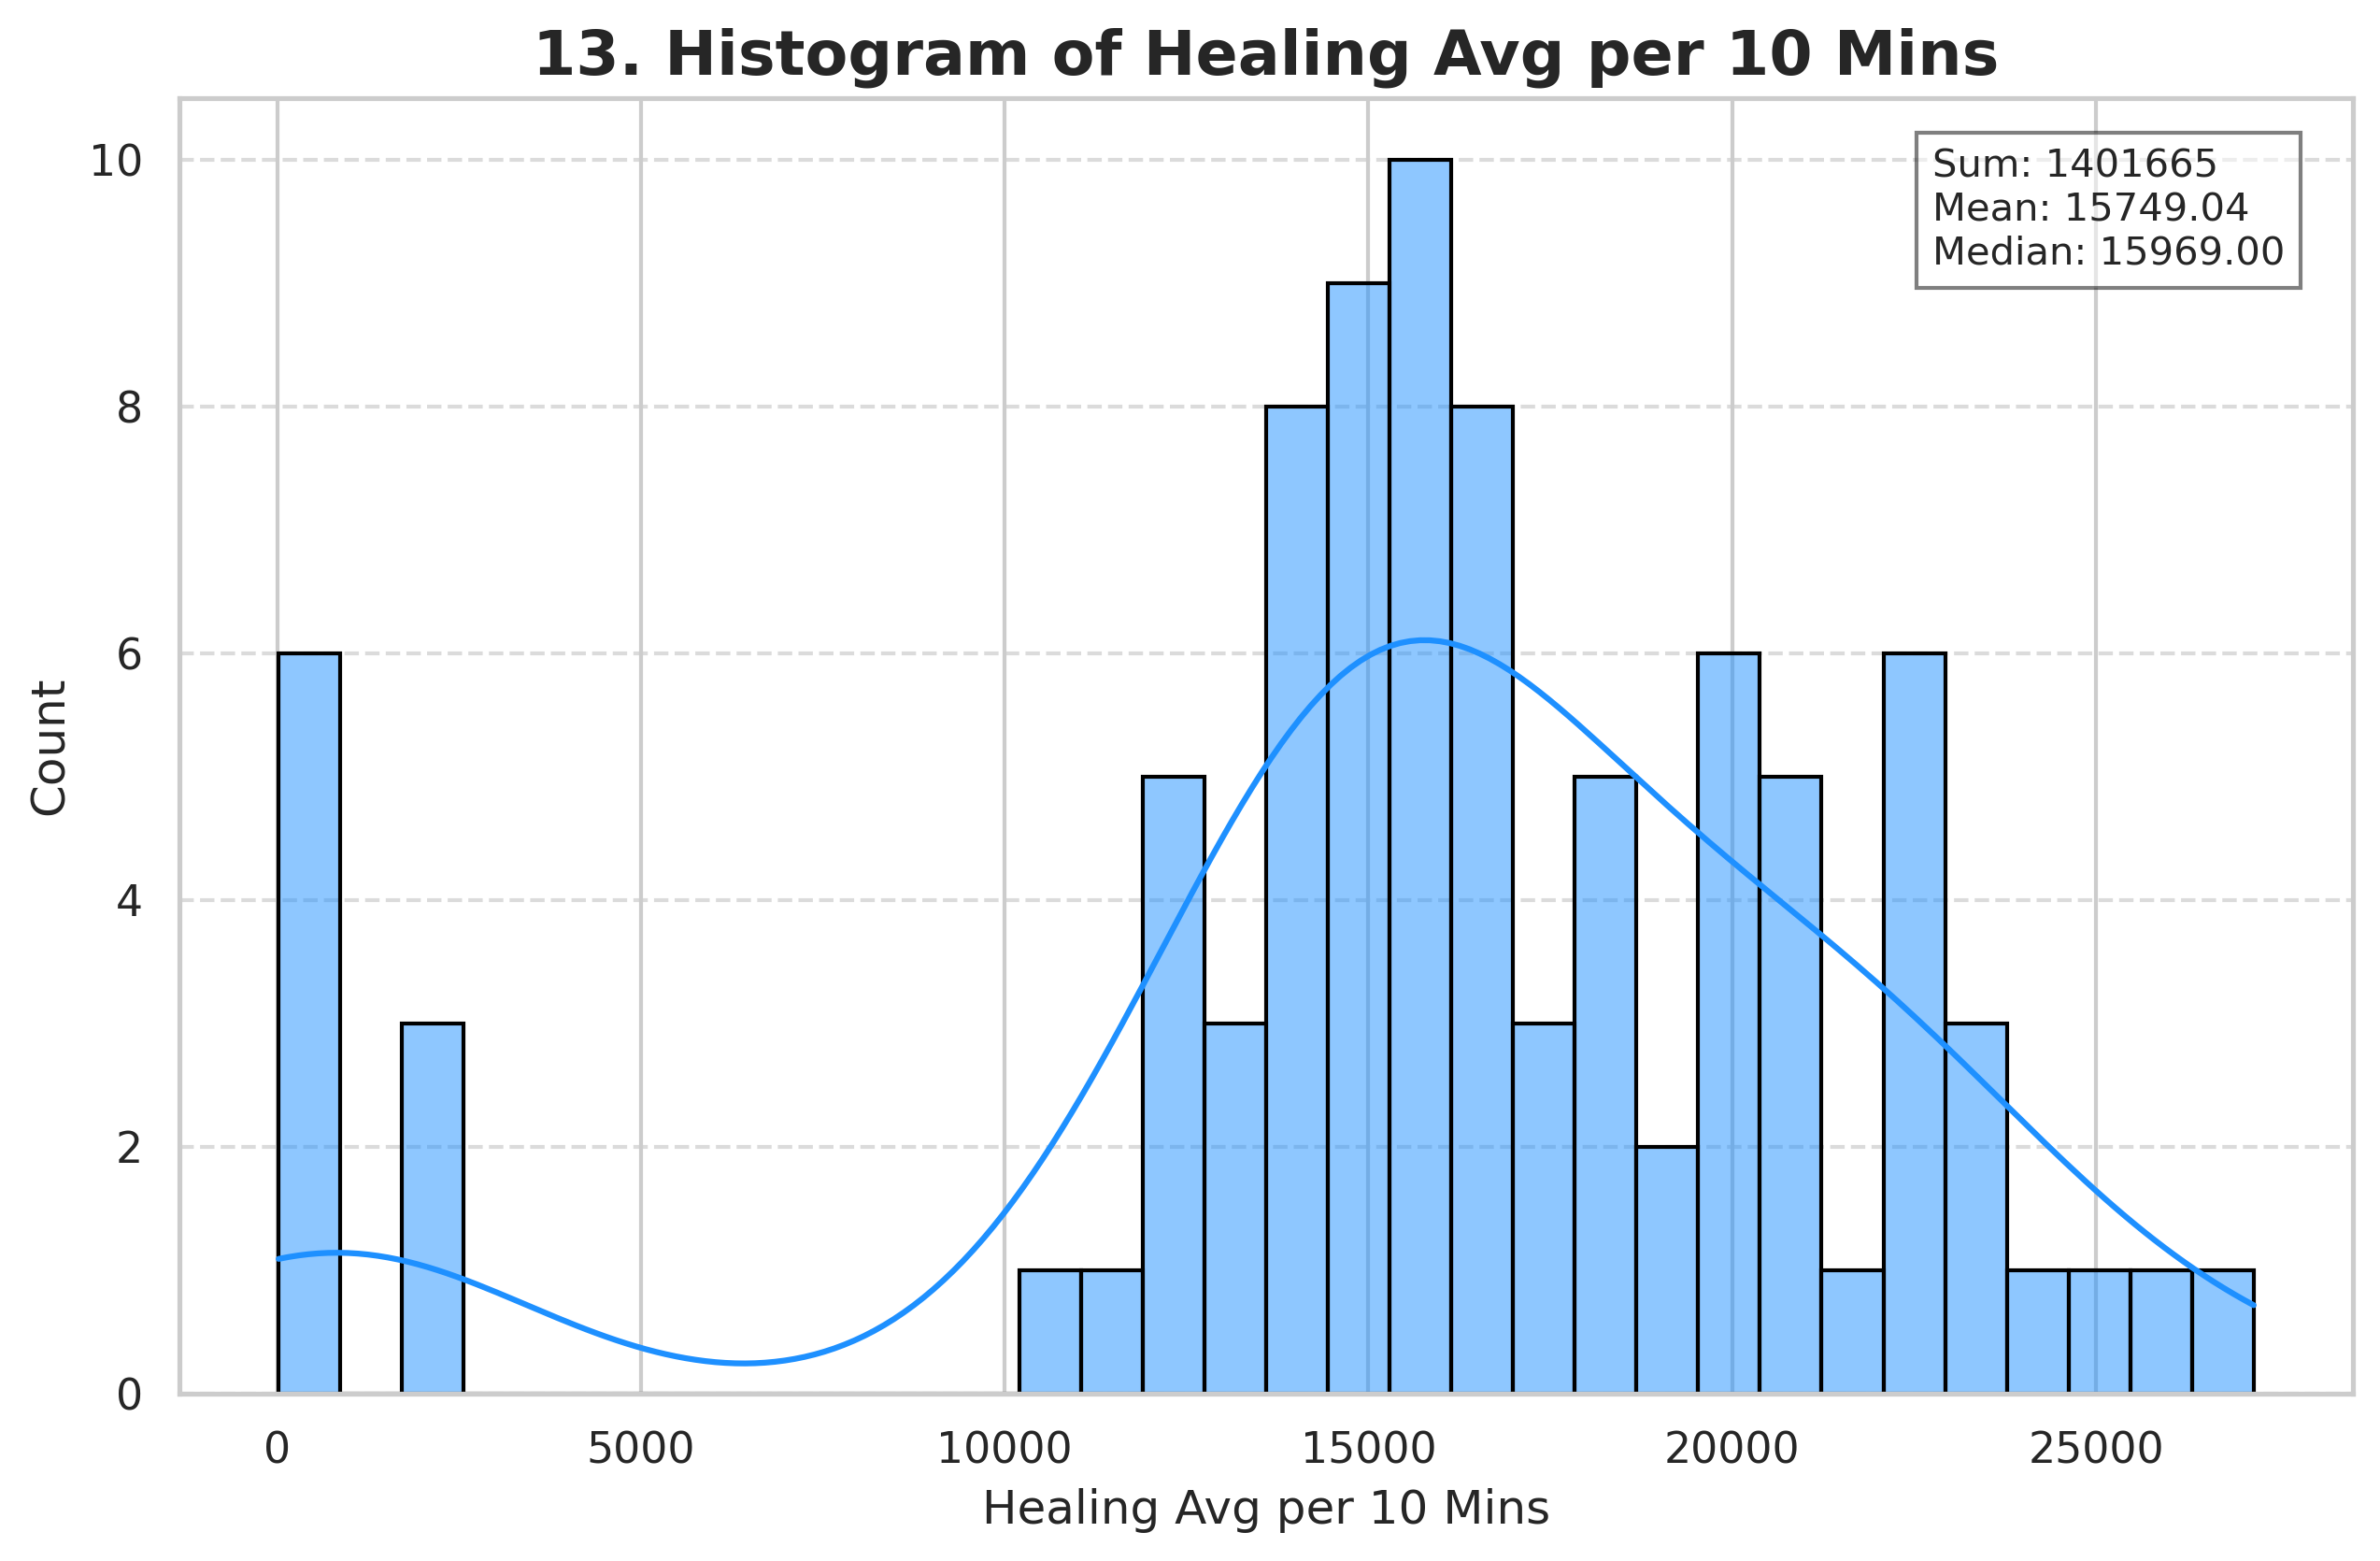
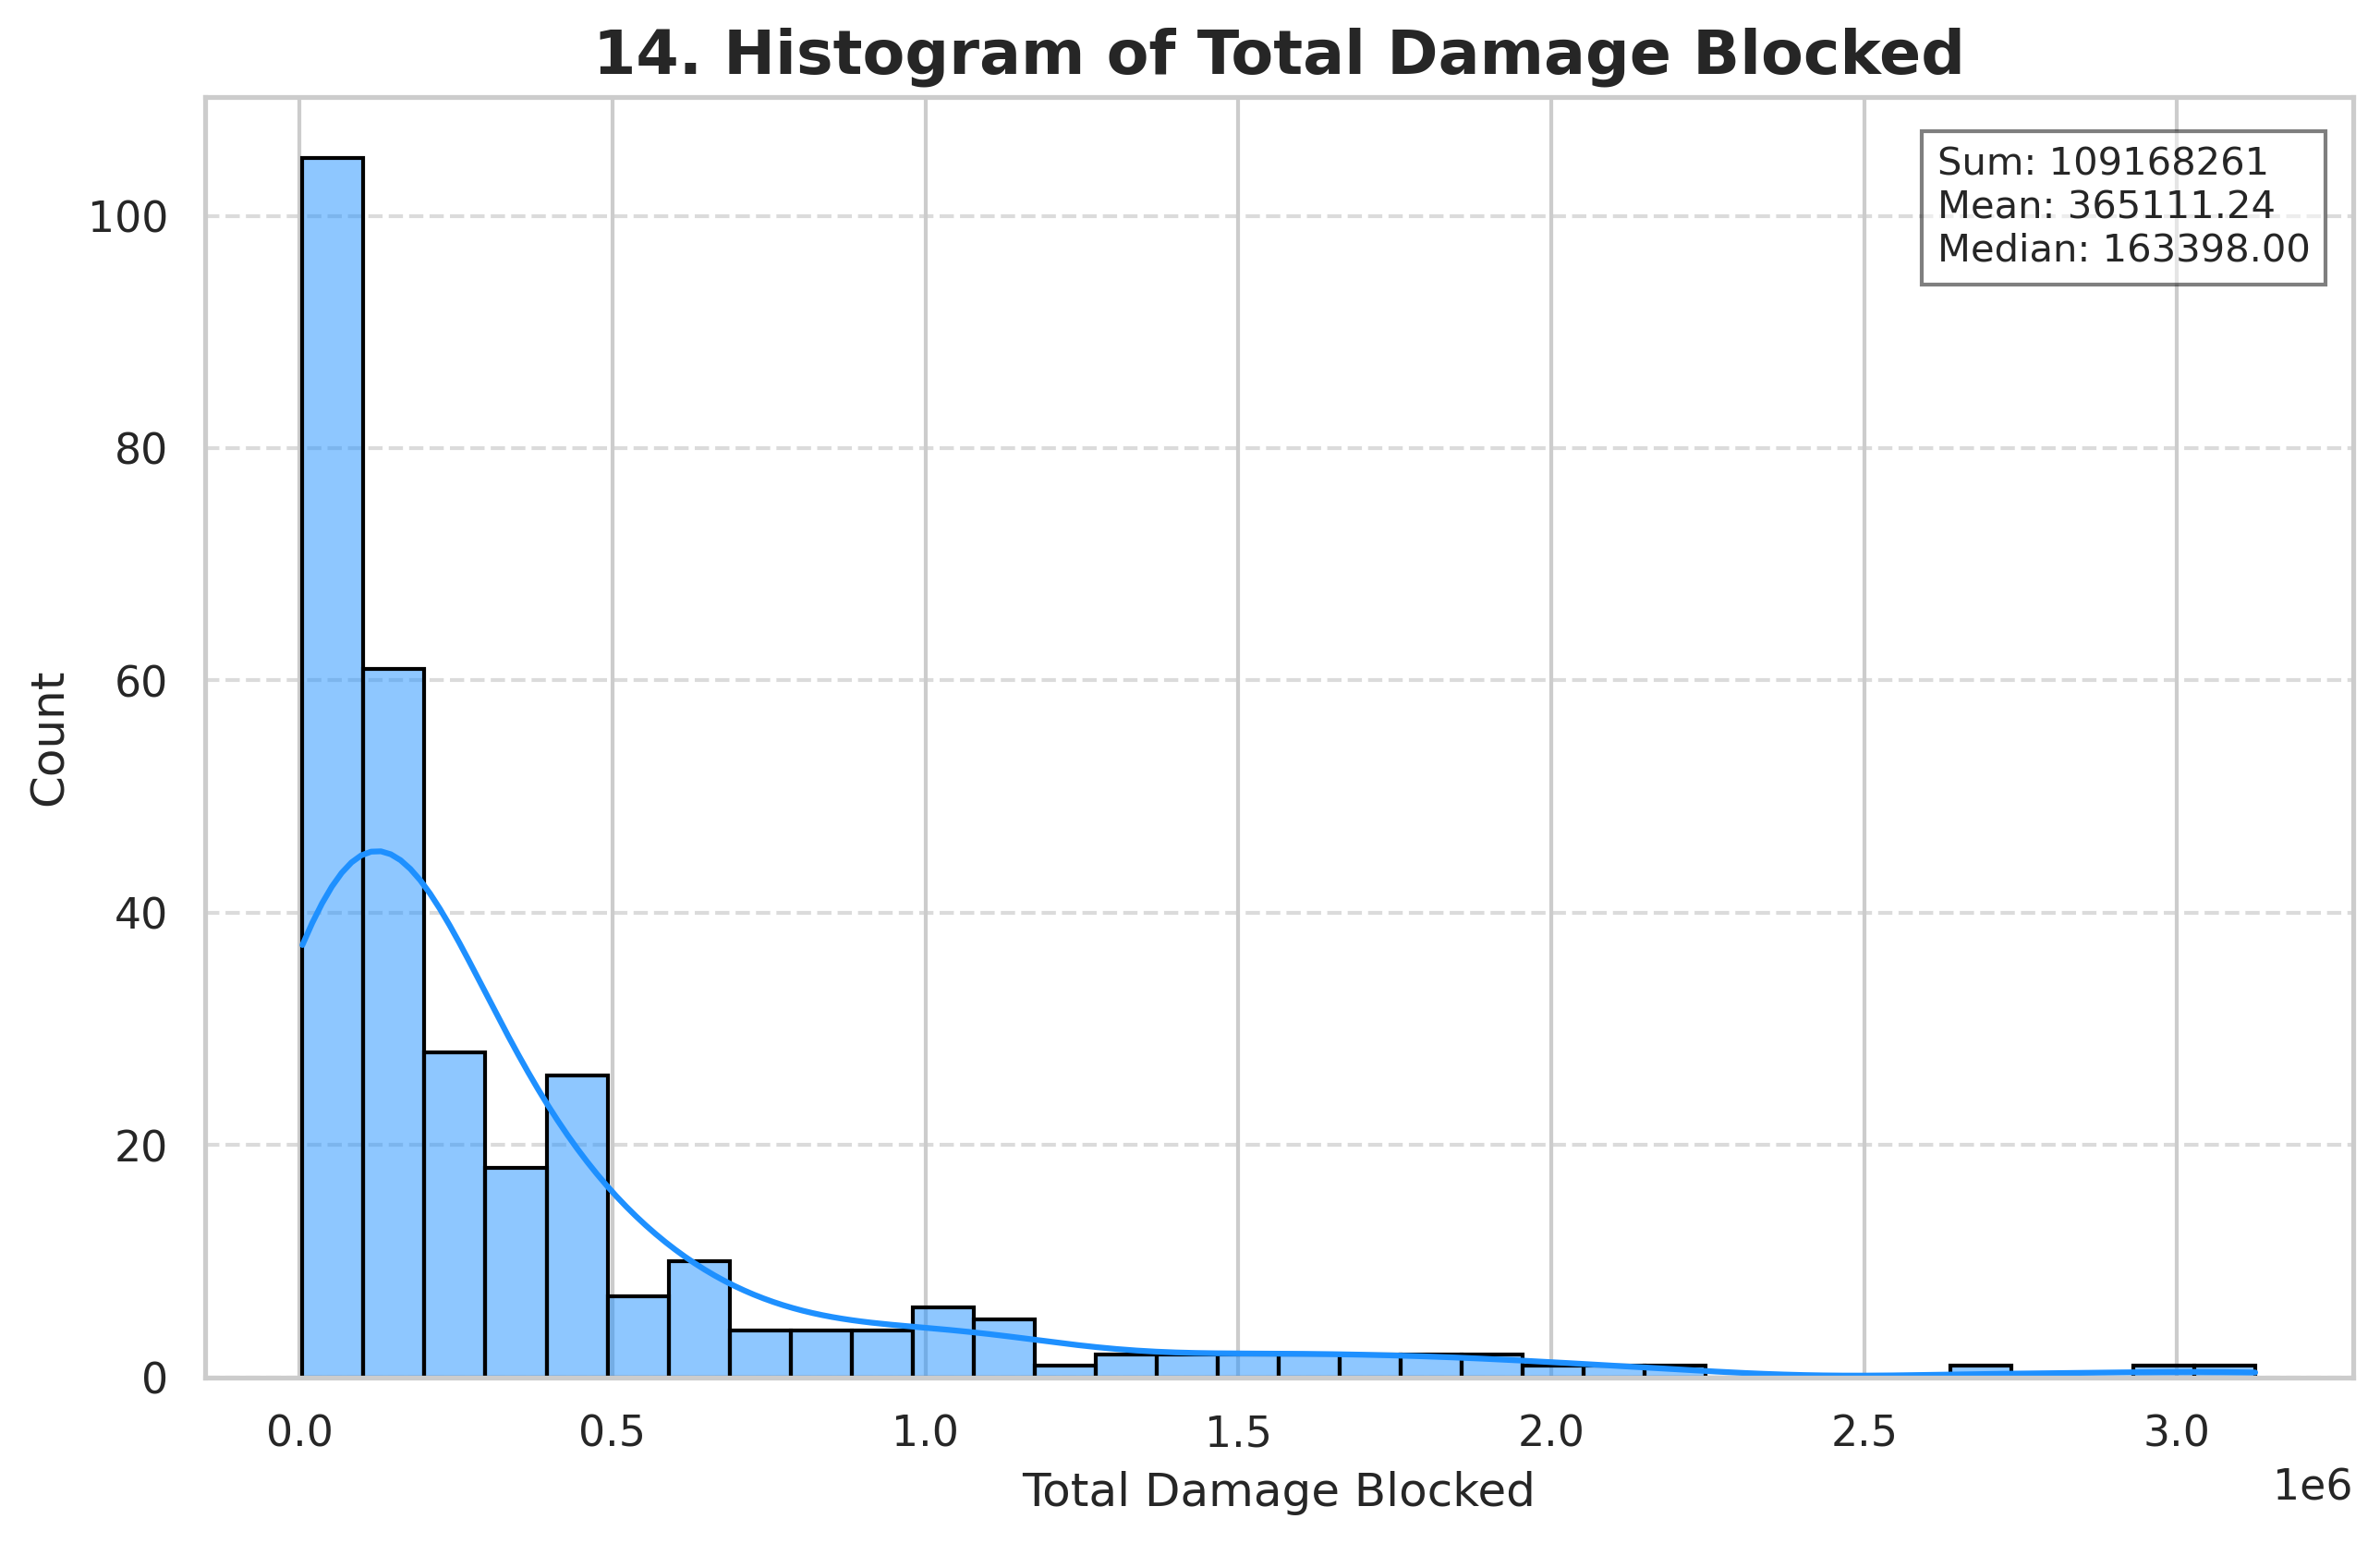
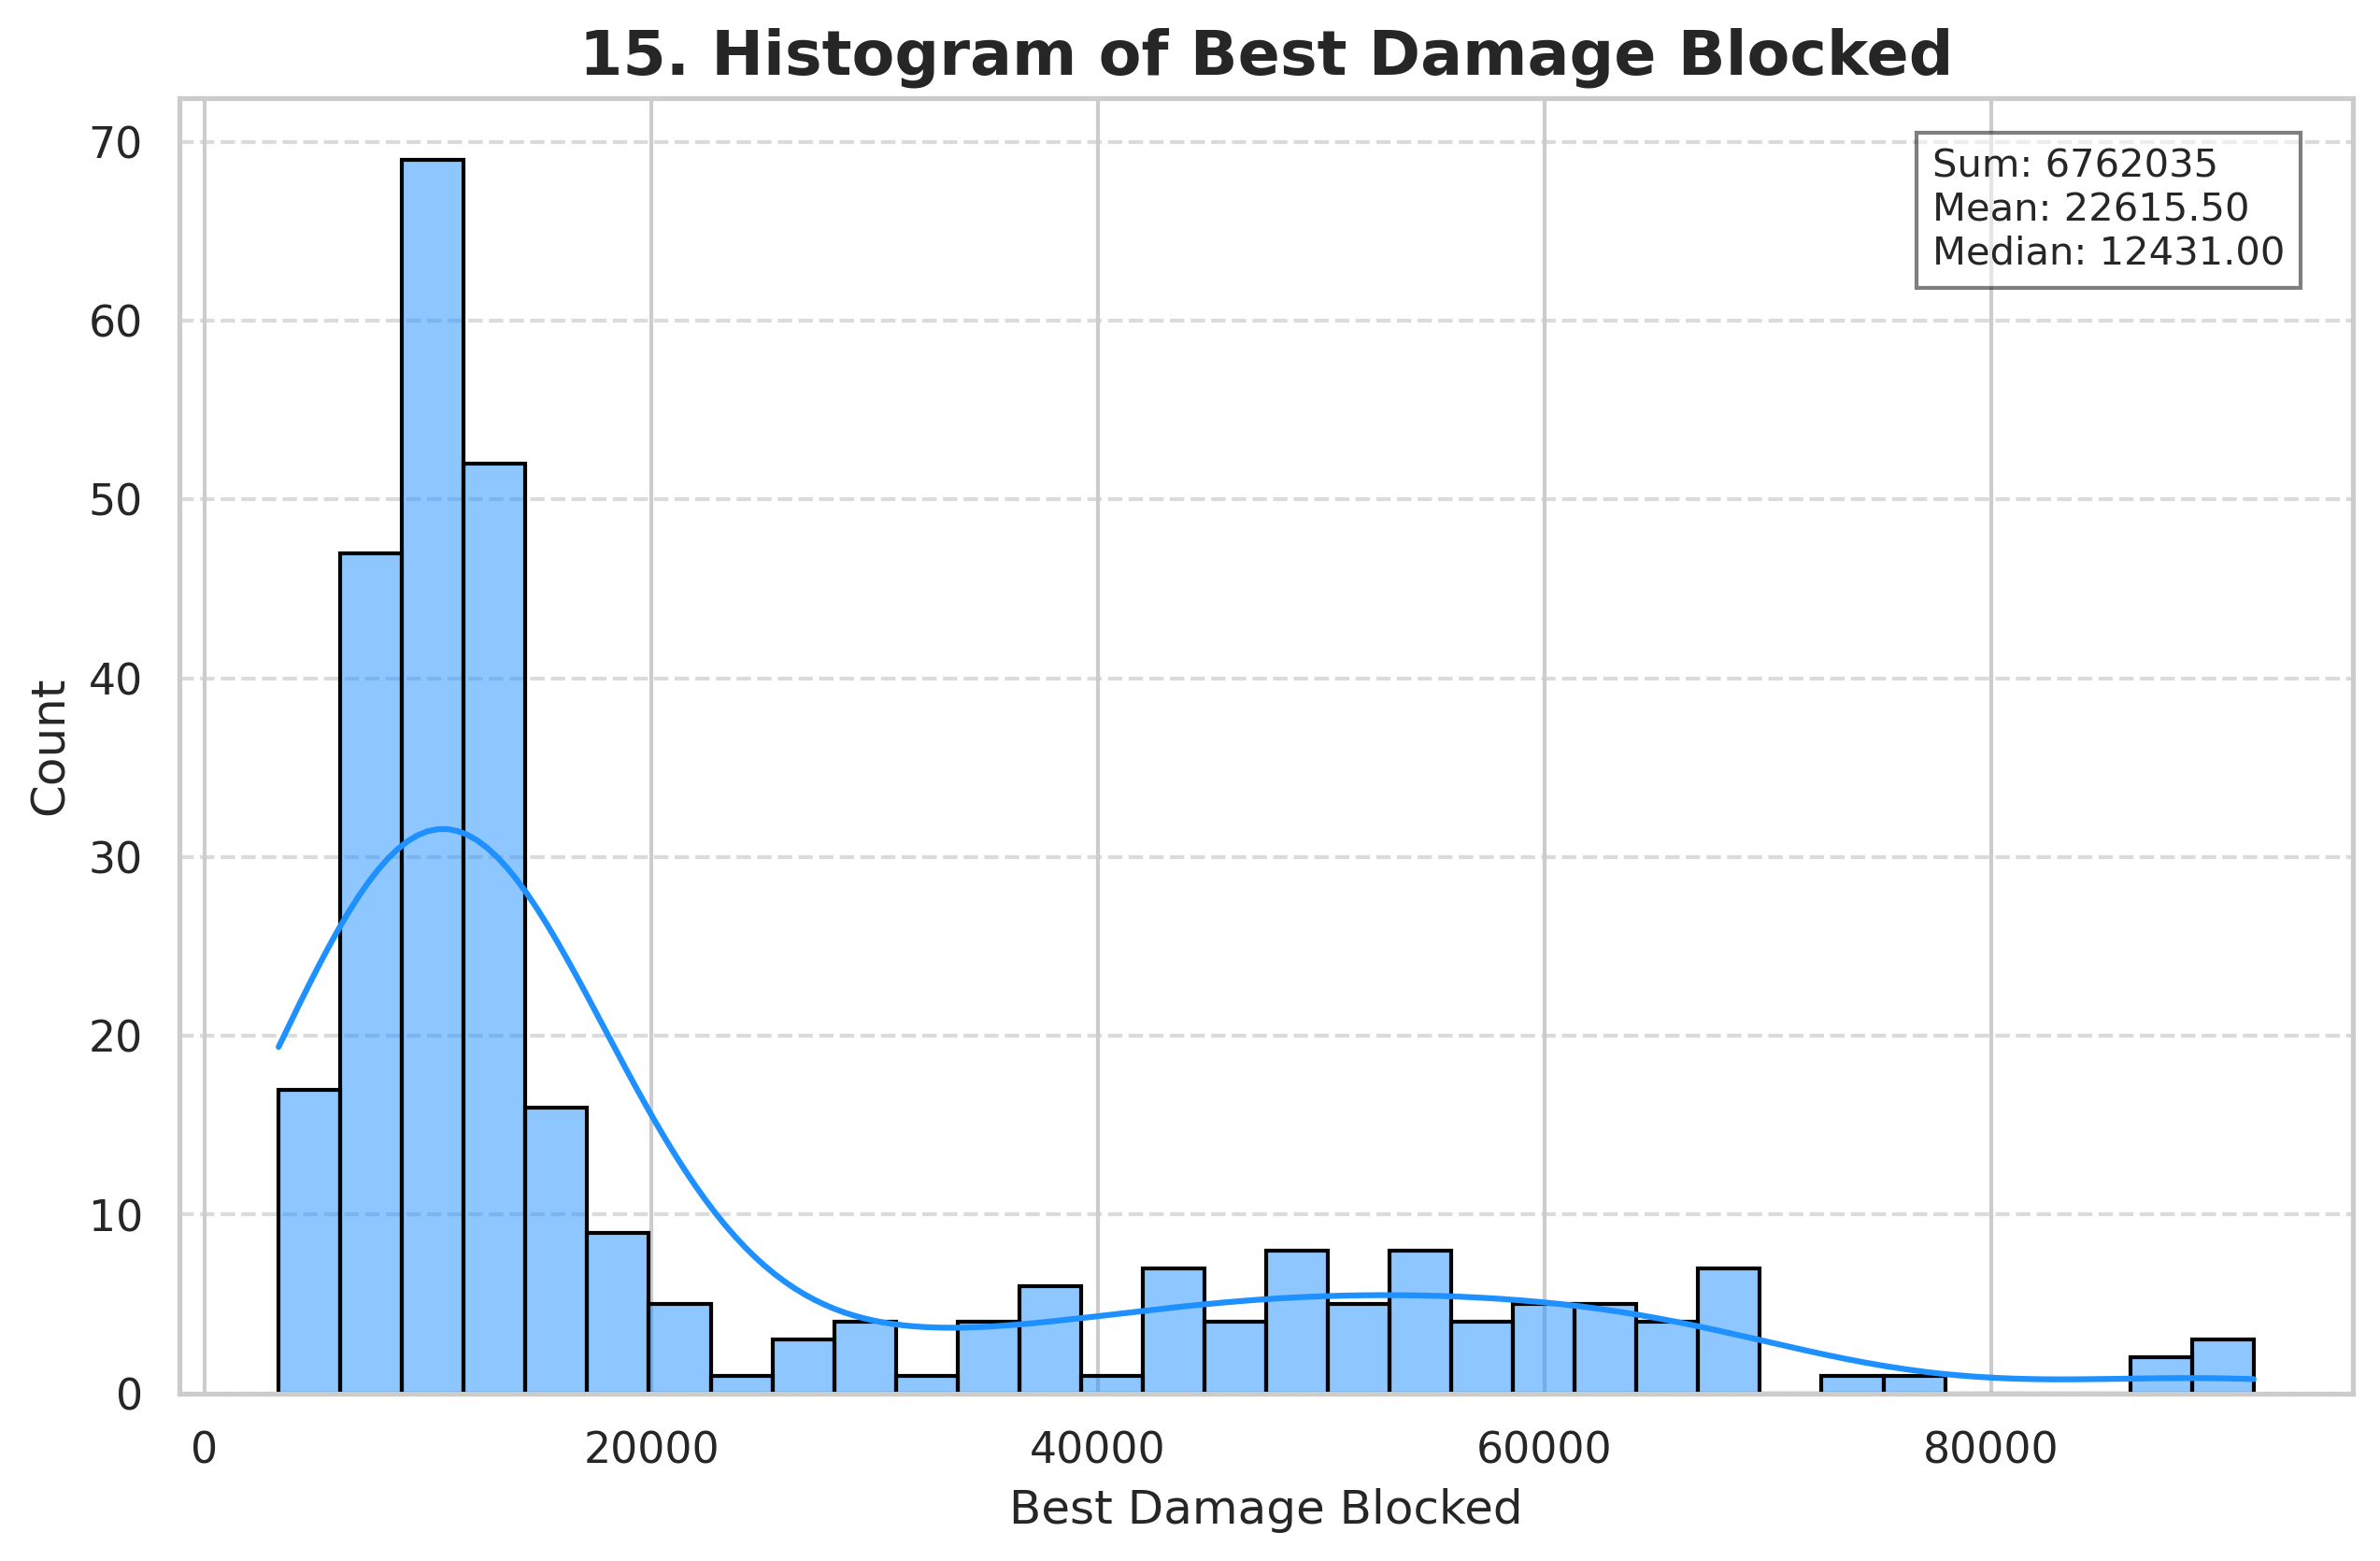
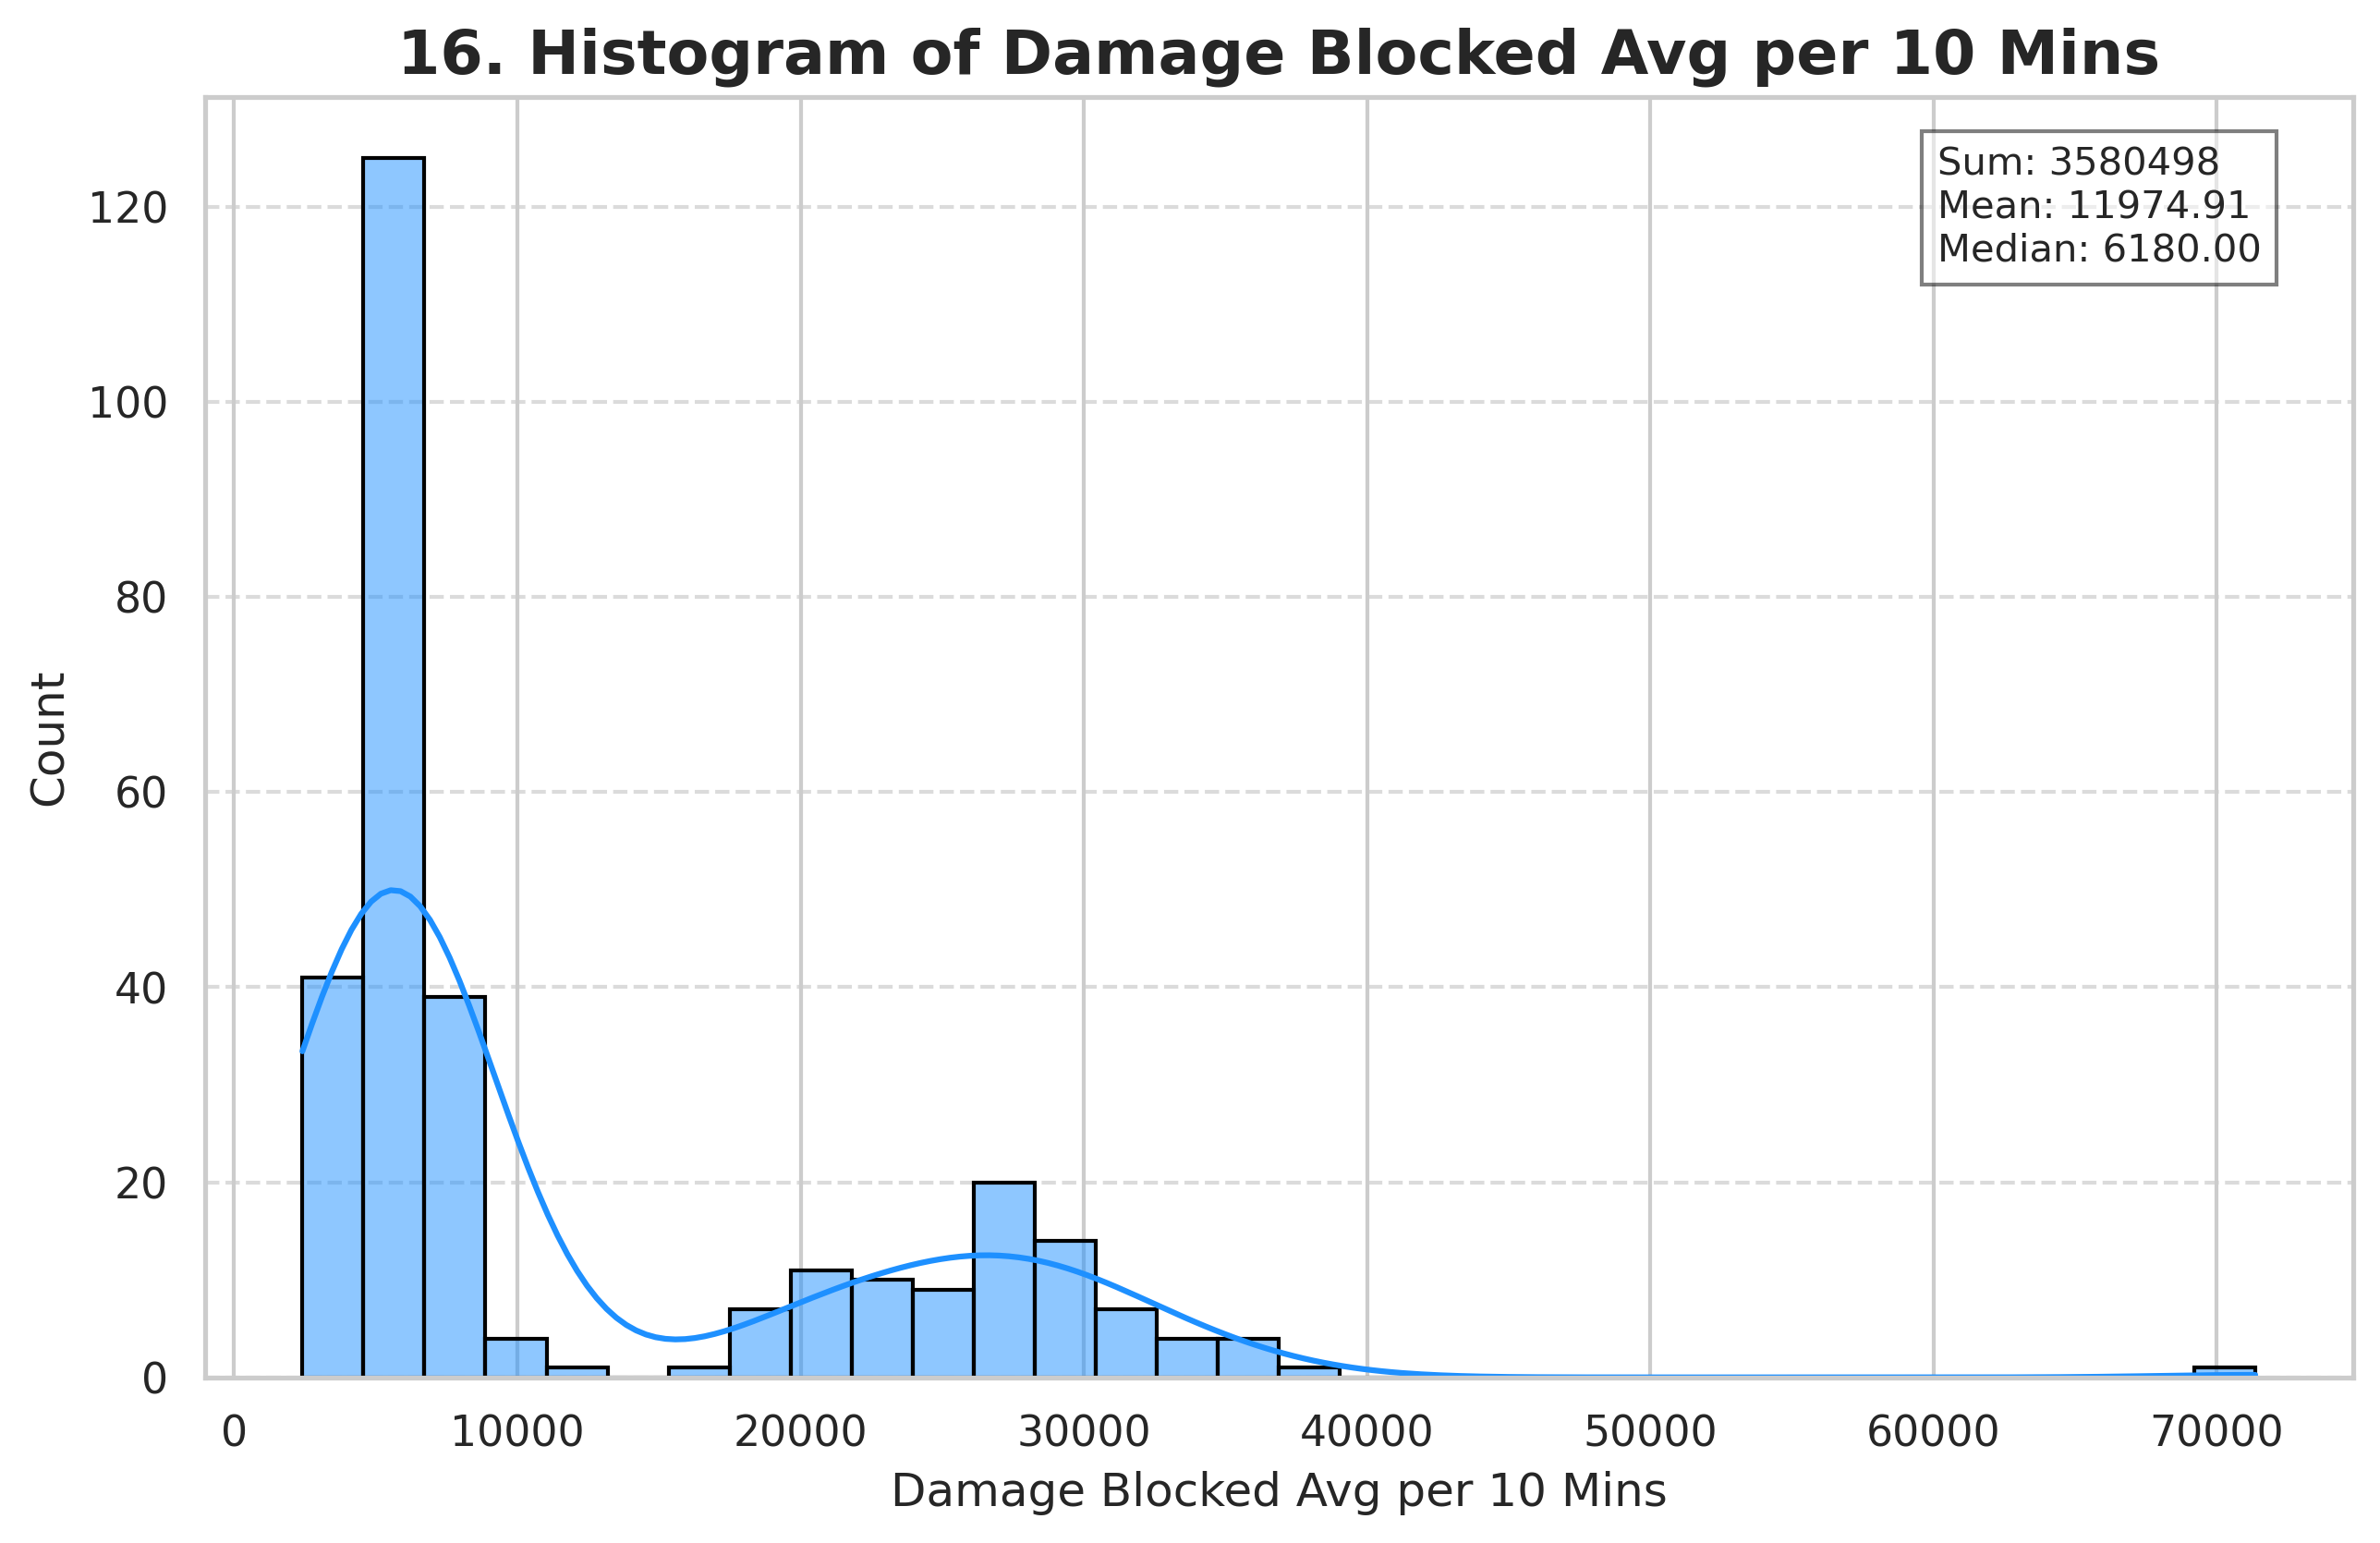
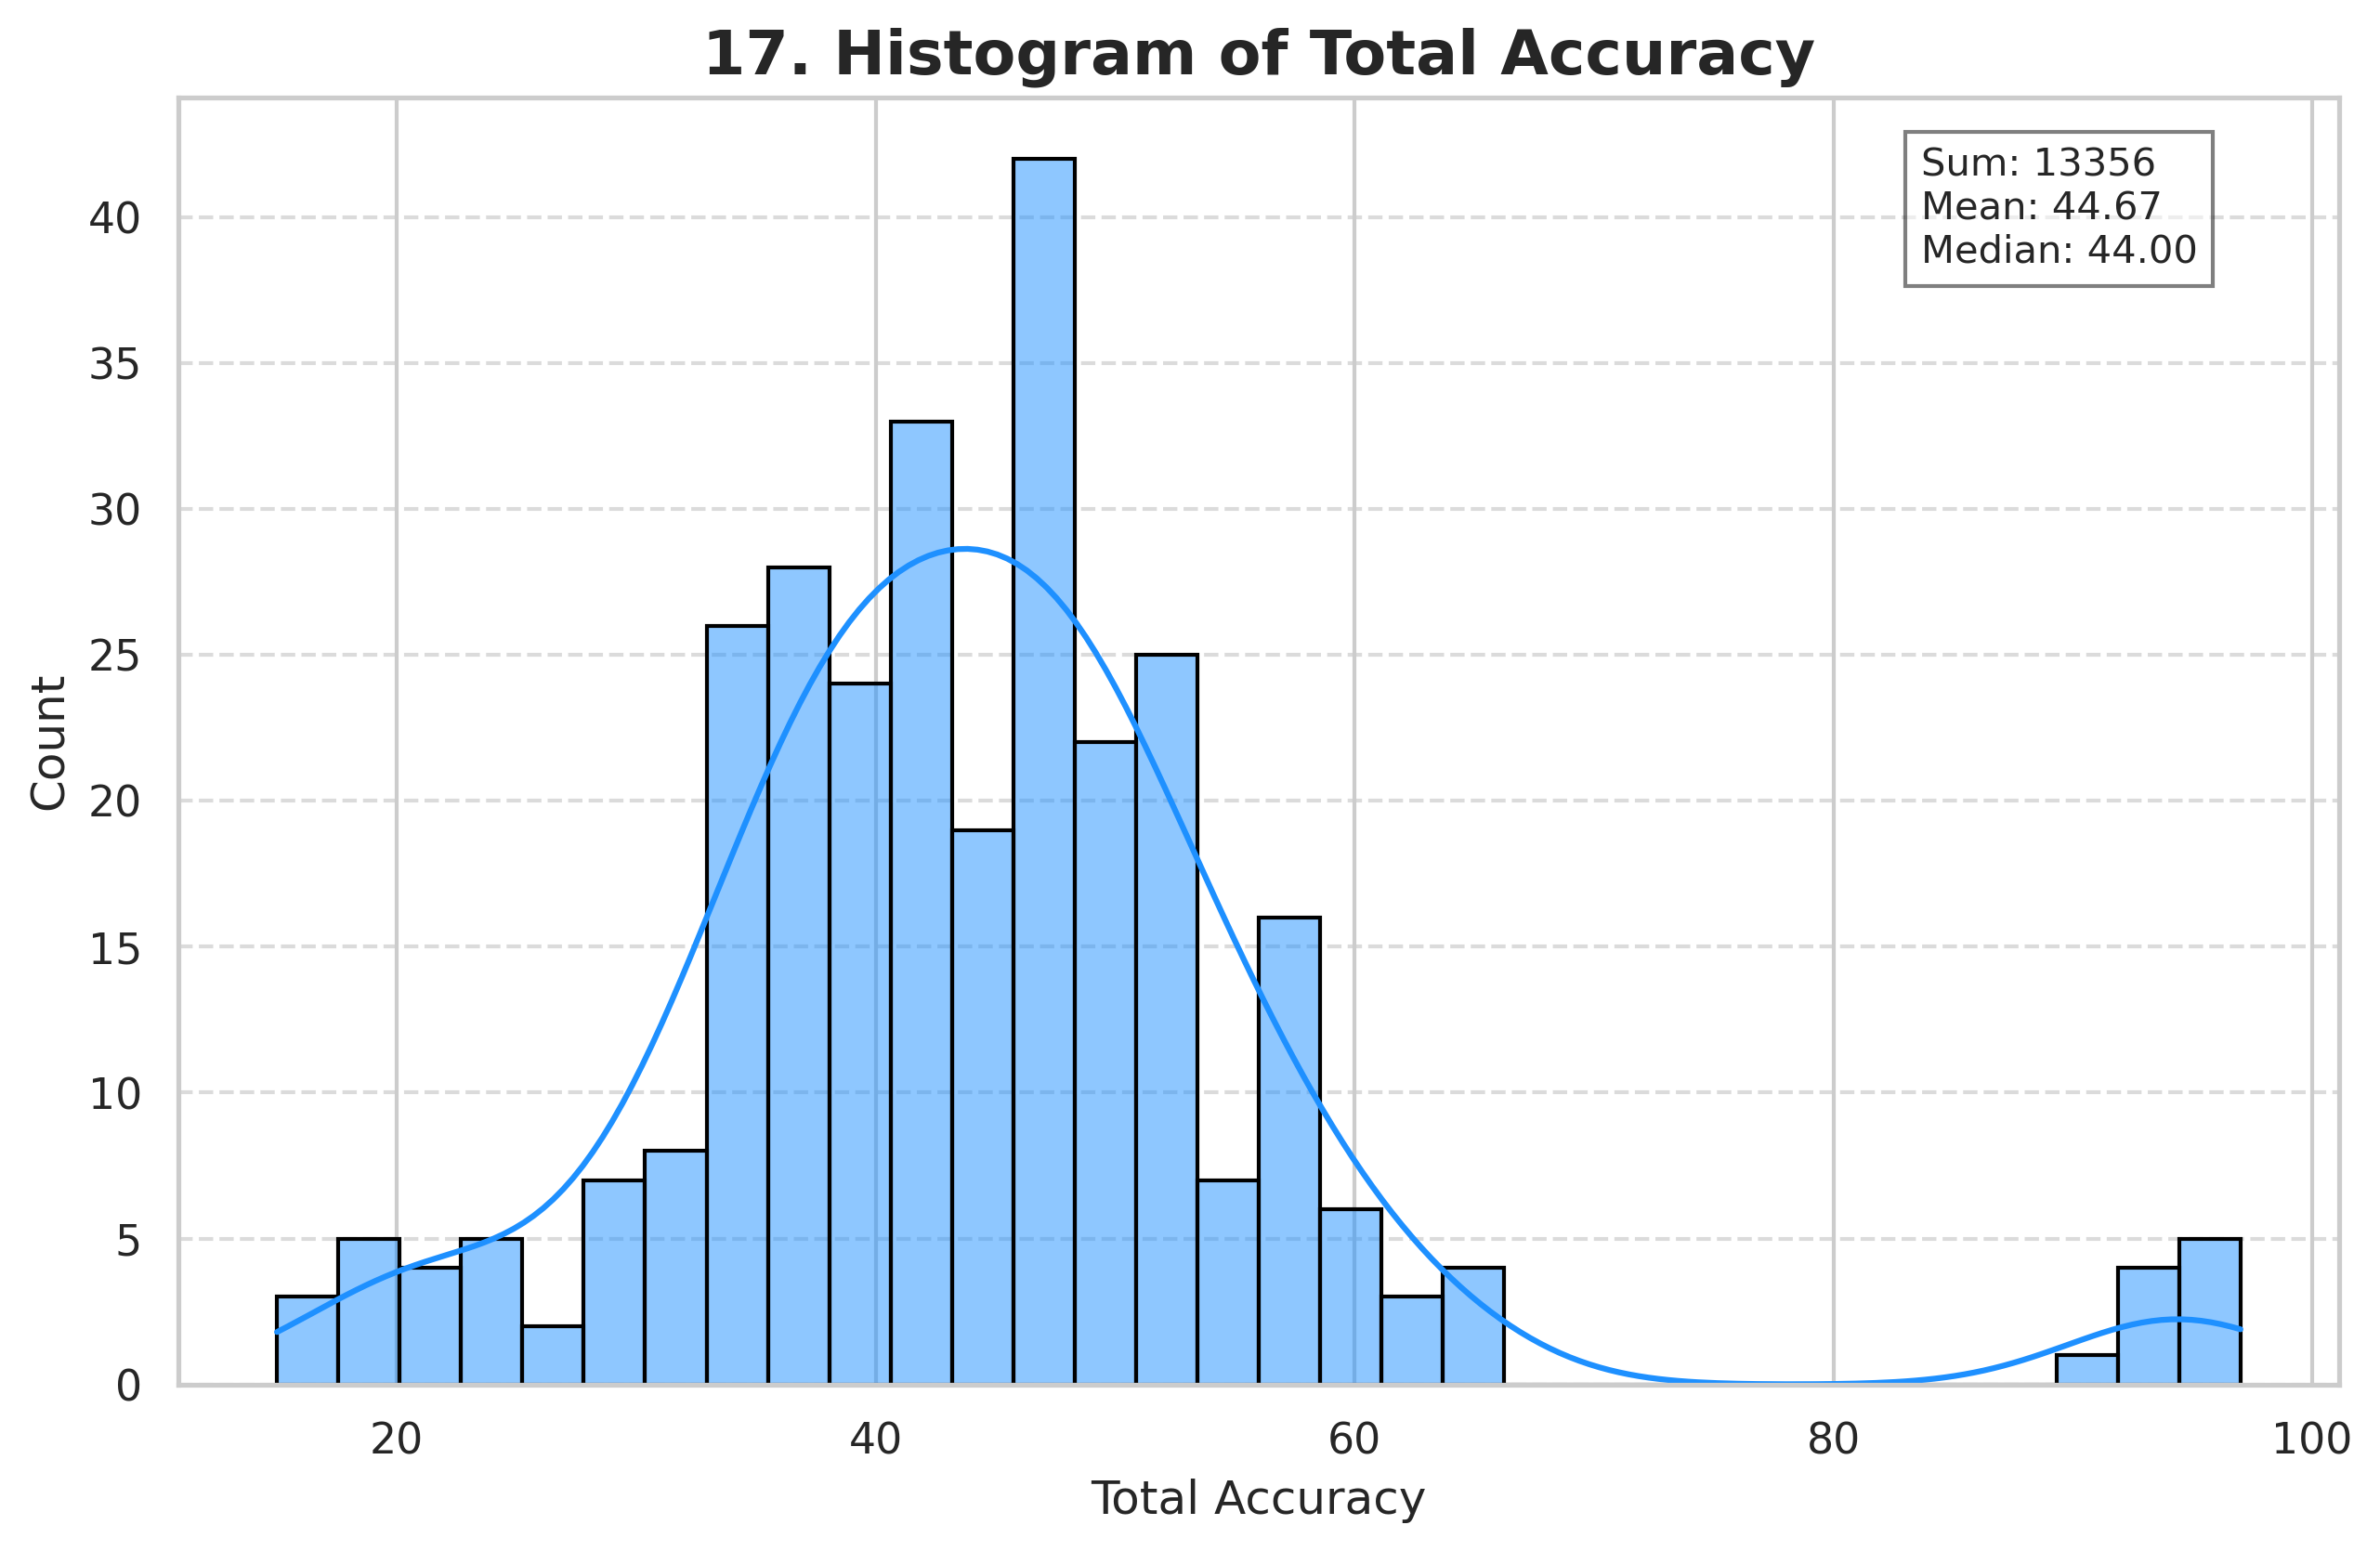
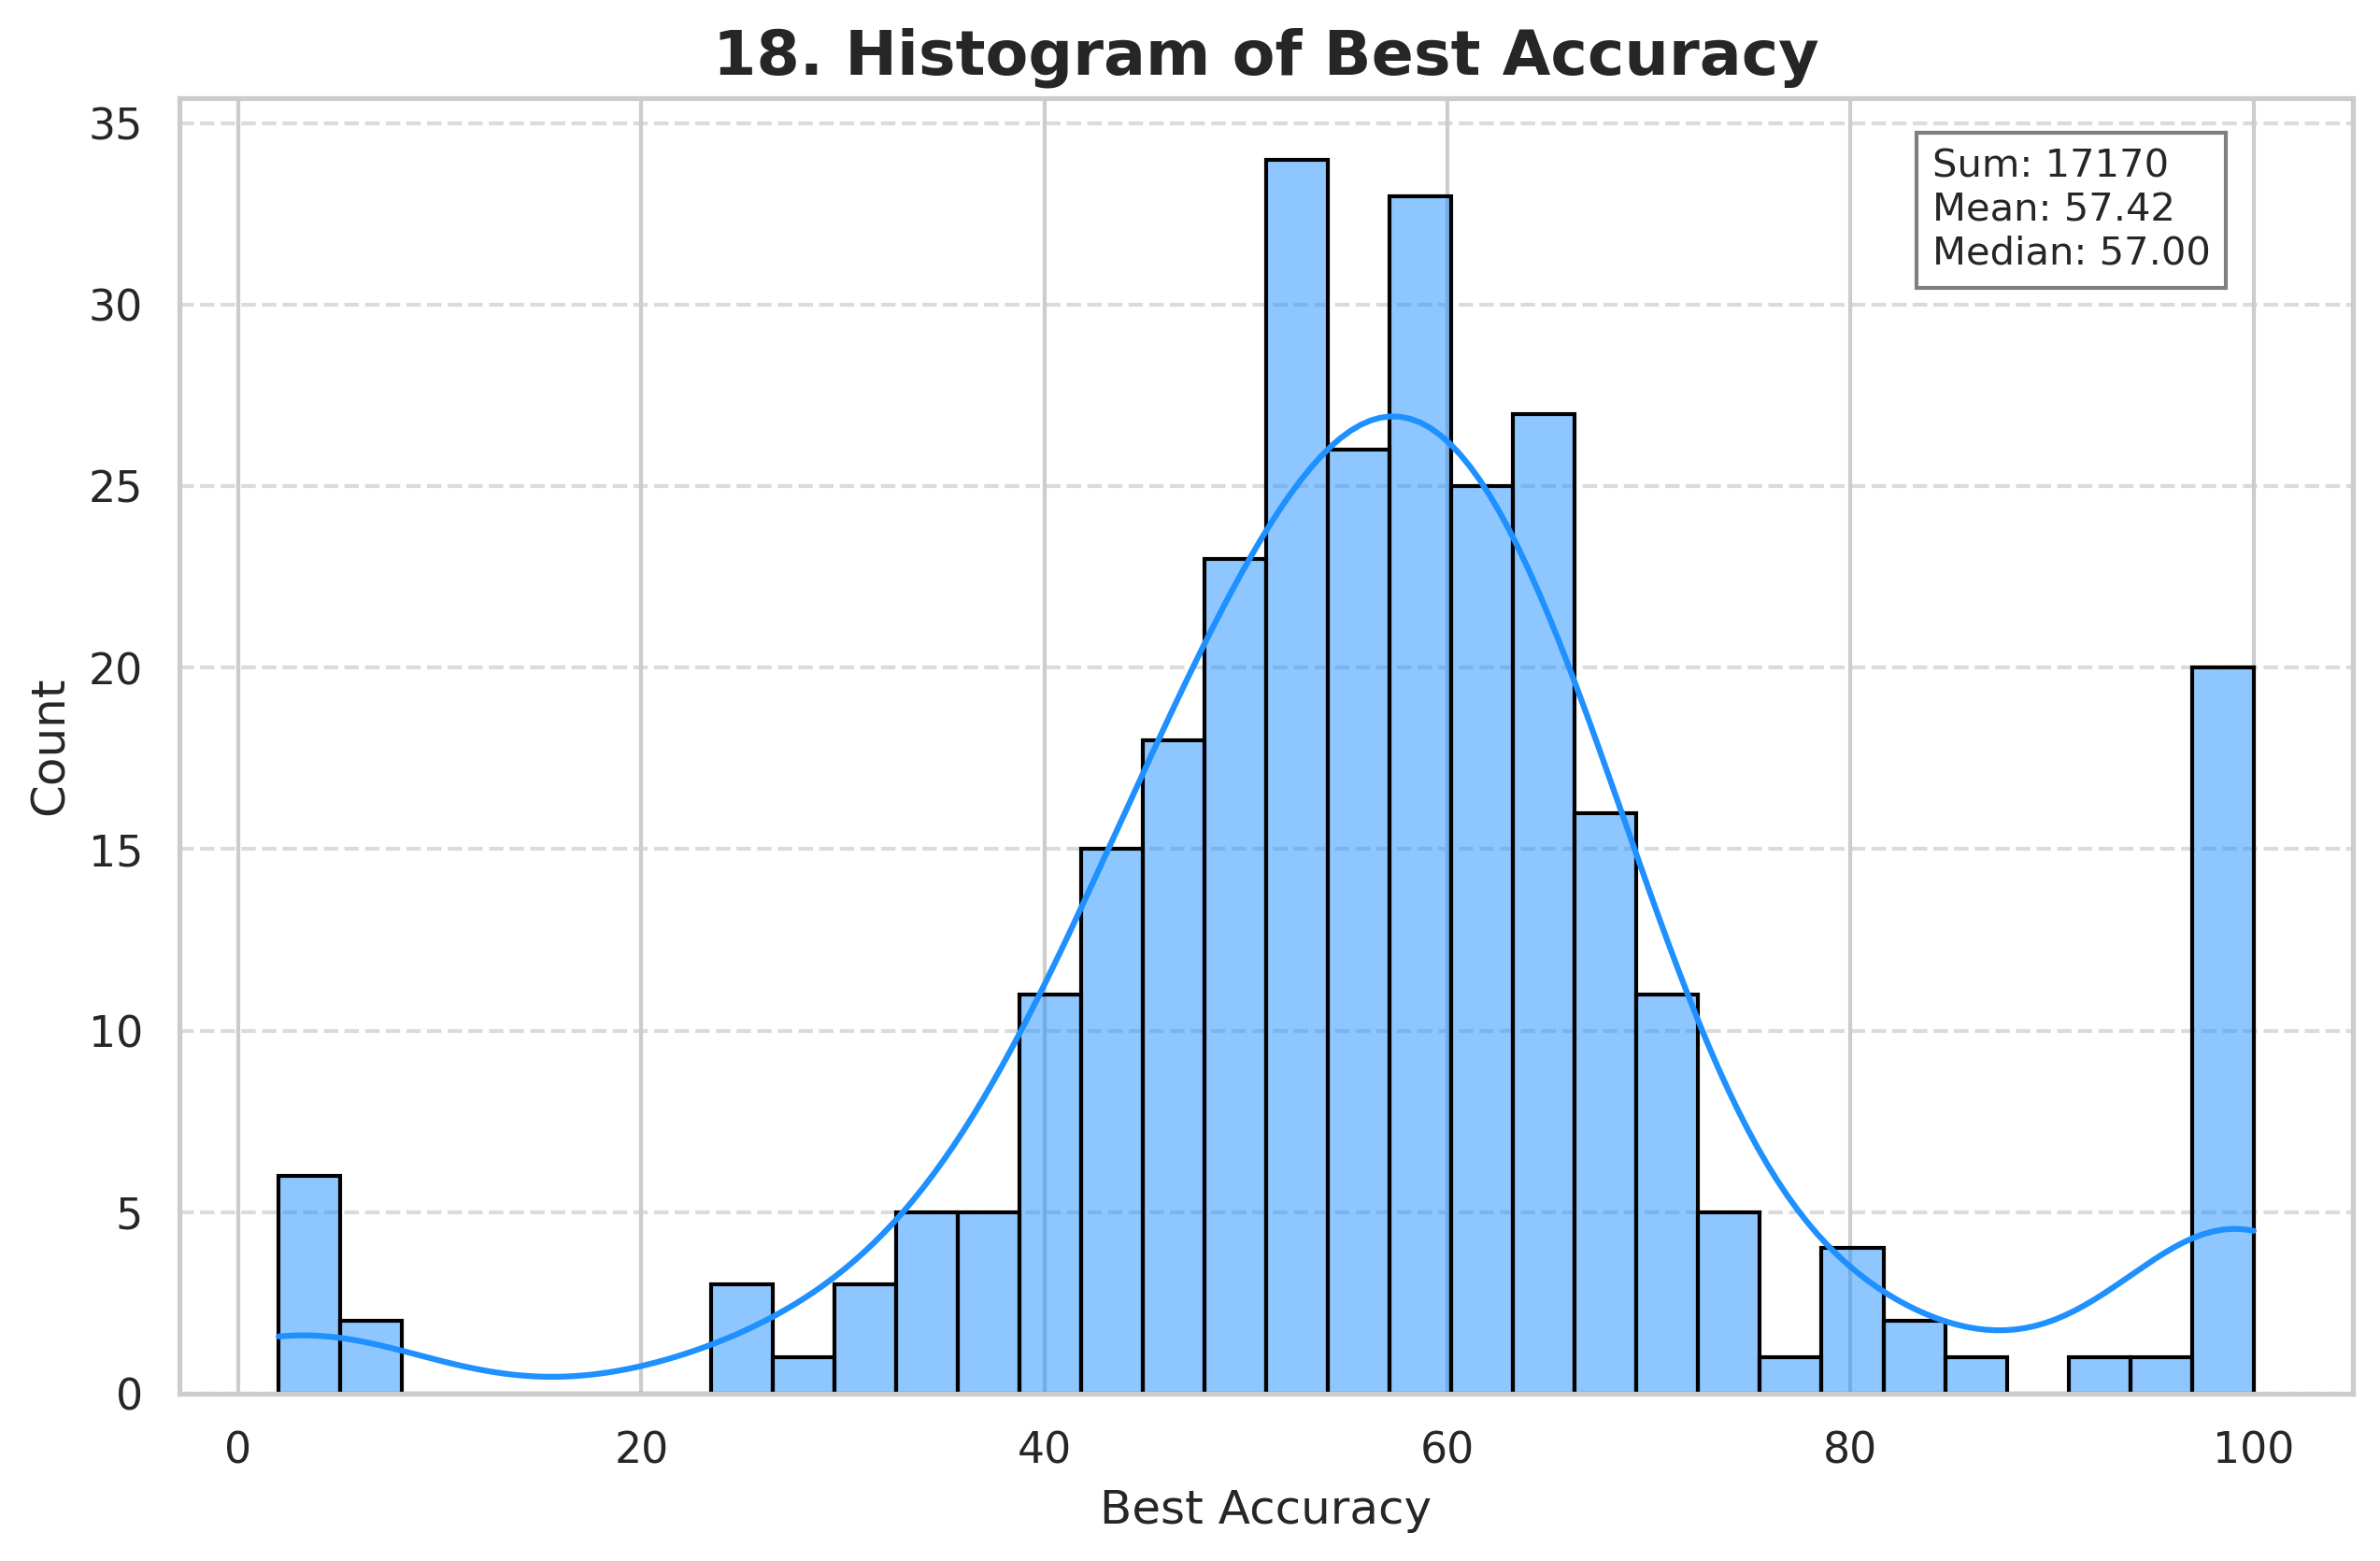
Alwaid and I went through the current (2024-12-12) top 100 players in Marvel Rivals whose profiles were public—so 130 in total including the non-public ones—and analysed the statistics for their top 3 heroes by play time. Below are the results.
Be aware, though, that there are some extreme outliers that are caused by OCR (optical character recognition) mistakes. We didn’t make an effort to thoroughly clean the data up as these should be relatively obvious.
Plots
Code
Here are the terrible Python scripts used for the analysis. Please don’t use them in production.
ocr.py
#!/usr/bin/env python3

import re
import sys

from PIL import Image
import pytesseract


class RectOCR:
    H_X1 = 996 // 2
    H_Y0 = 844 // 2
    H_DX = (1238 - 996) // 2
    H_DY = (932 - 844) // 2

    H_TIME_RECT = (
        H_X1 - 1 * H_DX,
        H_Y0,
        H_X1 - 1 * H_DX + H_DX // 2,
        H_Y0 + H_DY,
    )
    H_TIME_UNIT_RECT = (
        H_X1 - 1 * H_DX + H_DX // 2,
        H_Y0,
        H_X1 - 1 * H_DX + H_DX,
        H_Y0 + H_DY,
    )

    H_MATCHES = H_X1
    H_WINS = H_X1 + 1 * H_DX
    H_KO = H_X1 + 2 * H_DX
    H_ASS = H_X1 + 3 * H_DX
    H_STREAK = H_X1 + 4 * H_DX

    S_X0 = 1192 // 2
    S_Y0 = 1500 // 2
    S_DX = 333 // 2
    S_DY = 84 // 2
    S_DAMAGE = (S_X0, S_Y0 + 0 * S_DY)
    S_HEAL = (S_X0, S_Y0 + 1 * S_DY)
    S_BLOCK = (S_X0, S_Y0 + 2 * S_DY)
    S_ACC = (S_X0, S_Y0 + 3 * S_DY)

    time = 0.0
    matches = 0.0
    wins = 0.0
    ko = 0.0
    ass = 0.0
    streak = 0.0

    damage_total = 0.0
    heal_total = 0.0
    block_total = 0.0
    acc_total = 0.0

    damage_best = 0.0
    heal_best = 0.0
    block_best = 0.0
    acc_best = 0.0

    damage_avg_10 = 0.0
    heal_avg_10 = 0.0
    block_avg_10 = 0.0
    acc_avg_10 = 0.0

    def __init__(self):
        pass

    def get_h_rect(self, x):
        return (x, self.H_Y0, x + self.H_DX, self.H_Y0 + self.H_DY)

    def get_s_rects(self, top_left):
        x0 = top_left[0]
        y0 = top_left[1]
        return [
            (x0 + 0 * self.S_DX, y0, x0 + 1 * self.S_DX, y0 + self.S_DY),
            (x0 + 1 * self.S_DX, y0, x0 + 2 * self.S_DX, y0 + self.S_DY),
            (x0 + 2 * self.S_DX, y0, x0 + 3 * self.S_DX, y0 + self.S_DY),
        ]

    def __str__(self):
        return ",".join(
            str(i)
            for i in [
                self.time,
                self.matches,
                self.wins,
                self.ko,
                self.ass,
                self.streak,
                self.damage_total,
                self.damage_best,
                self.damage_avg_10,
                self.heal_total,
                self.heal_best,
                self.heal_avg_10,
                self.block_total,
                self.block_best,
                self.block_avg_10,
                self.acc_total,
                self.acc_best,
                self.acc_avg_10,
            ]
        )


def get_float(img):
    text = pytesseract.image_to_string(img)
    clean_text = re.sub(r"[^0-9\.]", "", text)
    if len(clean_text) == 0:
        return -1
    else:
        try:
            return float(clean_text)
        except Exception as e:
            return -1


def get_ocrs(image_path):
    try:
        with Image.open(image_path) as img:
            rects = RectOCR()

            rects.time = get_float(img.crop(rects.H_TIME_RECT))
            if rects.time != -1 and "HRS" not in pytesseract.image_to_string(
                img.crop(rects.H_TIME_UNIT_RECT)
            ):
                rects.time /= 60.0

            rects.matches = get_float(img.crop(rects.get_h_rect(rects.H_MATCHES)))
            rects.wins = get_float(img.crop(rects.get_h_rect(rects.H_WINS)))
            rects.ko = get_float(img.crop(rects.get_h_rect(rects.H_KO)))
            rects.ass = get_float(img.crop(rects.get_h_rect(rects.H_ASS)))
            rects.streak = get_float(img.crop(rects.get_h_rect(rects.H_STREAK)))

            damage_rects = rects.get_s_rects(rects.S_DAMAGE)
            heal_rects = rects.get_s_rects(rects.S_HEAL)
            block_rects = rects.get_s_rects(rects.S_BLOCK)
            acc_rects = rects.get_s_rects(rects.S_ACC)

            rects.damage_total = get_float(img.crop(damage_rects[0]))
            rects.damage_best = get_float(img.crop(damage_rects[1]))
            rects.damage_avg_10 = get_float(img.crop(damage_rects[2]))

            rects.heal_total = get_float(img.crop(heal_rects[0]))
            rects.heal_best = get_float(img.crop(heal_rects[1]))
            rects.heal_avg_10 = get_float(img.crop(heal_rects[2]))

            rects.block_total = get_float(img.crop(block_rects[0]))
            rects.block_best = get_float(img.crop(block_rects[1]))
            rects.block_avg_10 = get_float(img.crop(block_rects[2]))

            rects.acc_total = get_float(img.crop(acc_rects[0]))
            rects.acc_best = get_float(img.crop(acc_rects[1]))
            rects.acc_avg_10 = get_float(img.crop(acc_rects[2]))

            return rects

    except Exception as e:
        print(f"Error reading the rectangle on the image: {e}")


if __name__ == "__main__":
    for path in sys.argv[1:]:
        text_content = get_ocrs(path)
        print(
            re.sub(r".*/([0-9]+)\s+.*", r"\g<1>", path).strip(),
            re.sub(r".*/[0-9]+\s+(.*)\s*\.[a-z]+", r"\g<1>", path).strip(),
            text_content,
            sep=",",
        )
plot.py
#!/usr/bin/env python3
import sys
import pandas as pd
import matplotlib.pyplot as plt
import seaborn as sns
csv = sys.argv[1]
output_directory = sys.argv[2]
data = pd.read_csv(csv)
hero_index = 1
hero_column = "Top Heroes"
columns = [
(0, "File Name"),
(hero_index, hero_column),
(2, "Time Played"),
(3, "Matches Played"),
(4, "Wins"),
(5, "KOs"),
(6, "Assists"),
(7, "Best KO Streak"),
(8, "Total Damage"),
(9, "Best Damage"),
(10, "Damage Avg per 10 Mins"),
(11, "Total Healing"),
(12, "Best Healing"),
(13, "Healing Avg per 10 Mins"),
(14, "Total Damage Blocked"),
(15, "Best Damage Blocked"),
(16, "Damage Blocked Avg per 10 Mins"),
(17, "Total Accuracy"),
(18, "Best Accuracy"),
(19, "Accuracy Avg per 10 Mins"),
]
data.columns = [column for _, column in columns]
sns.set_theme(style="whitegrid")
hero_counts = data[hero_column].value_counts()
plt.figure(figsize=(10, 6))
hero_counts.sort_values(ascending=True).plot(
kind="barh", color=sns.color_palette("pastel"), edgecolor="black"
)
plt.title(f"{hero_index}. Histogram of {hero_column}", fontsize=16, fontweight="bold")
plt.xlabel("Count", fontsize=12)
plt.ylabel("Hero", fontsize=12)
plt.grid(axis="x", linestyle="--", alpha=0.7)
hero_histogram_path = f"{output_directory}/{hero_index}. {hero_column}.png"
plt.savefig(hero_histogram_path, bbox_inches="tight", dpi=300)
plt.close()
print(f"Saved plot to {hero_histogram_path}")
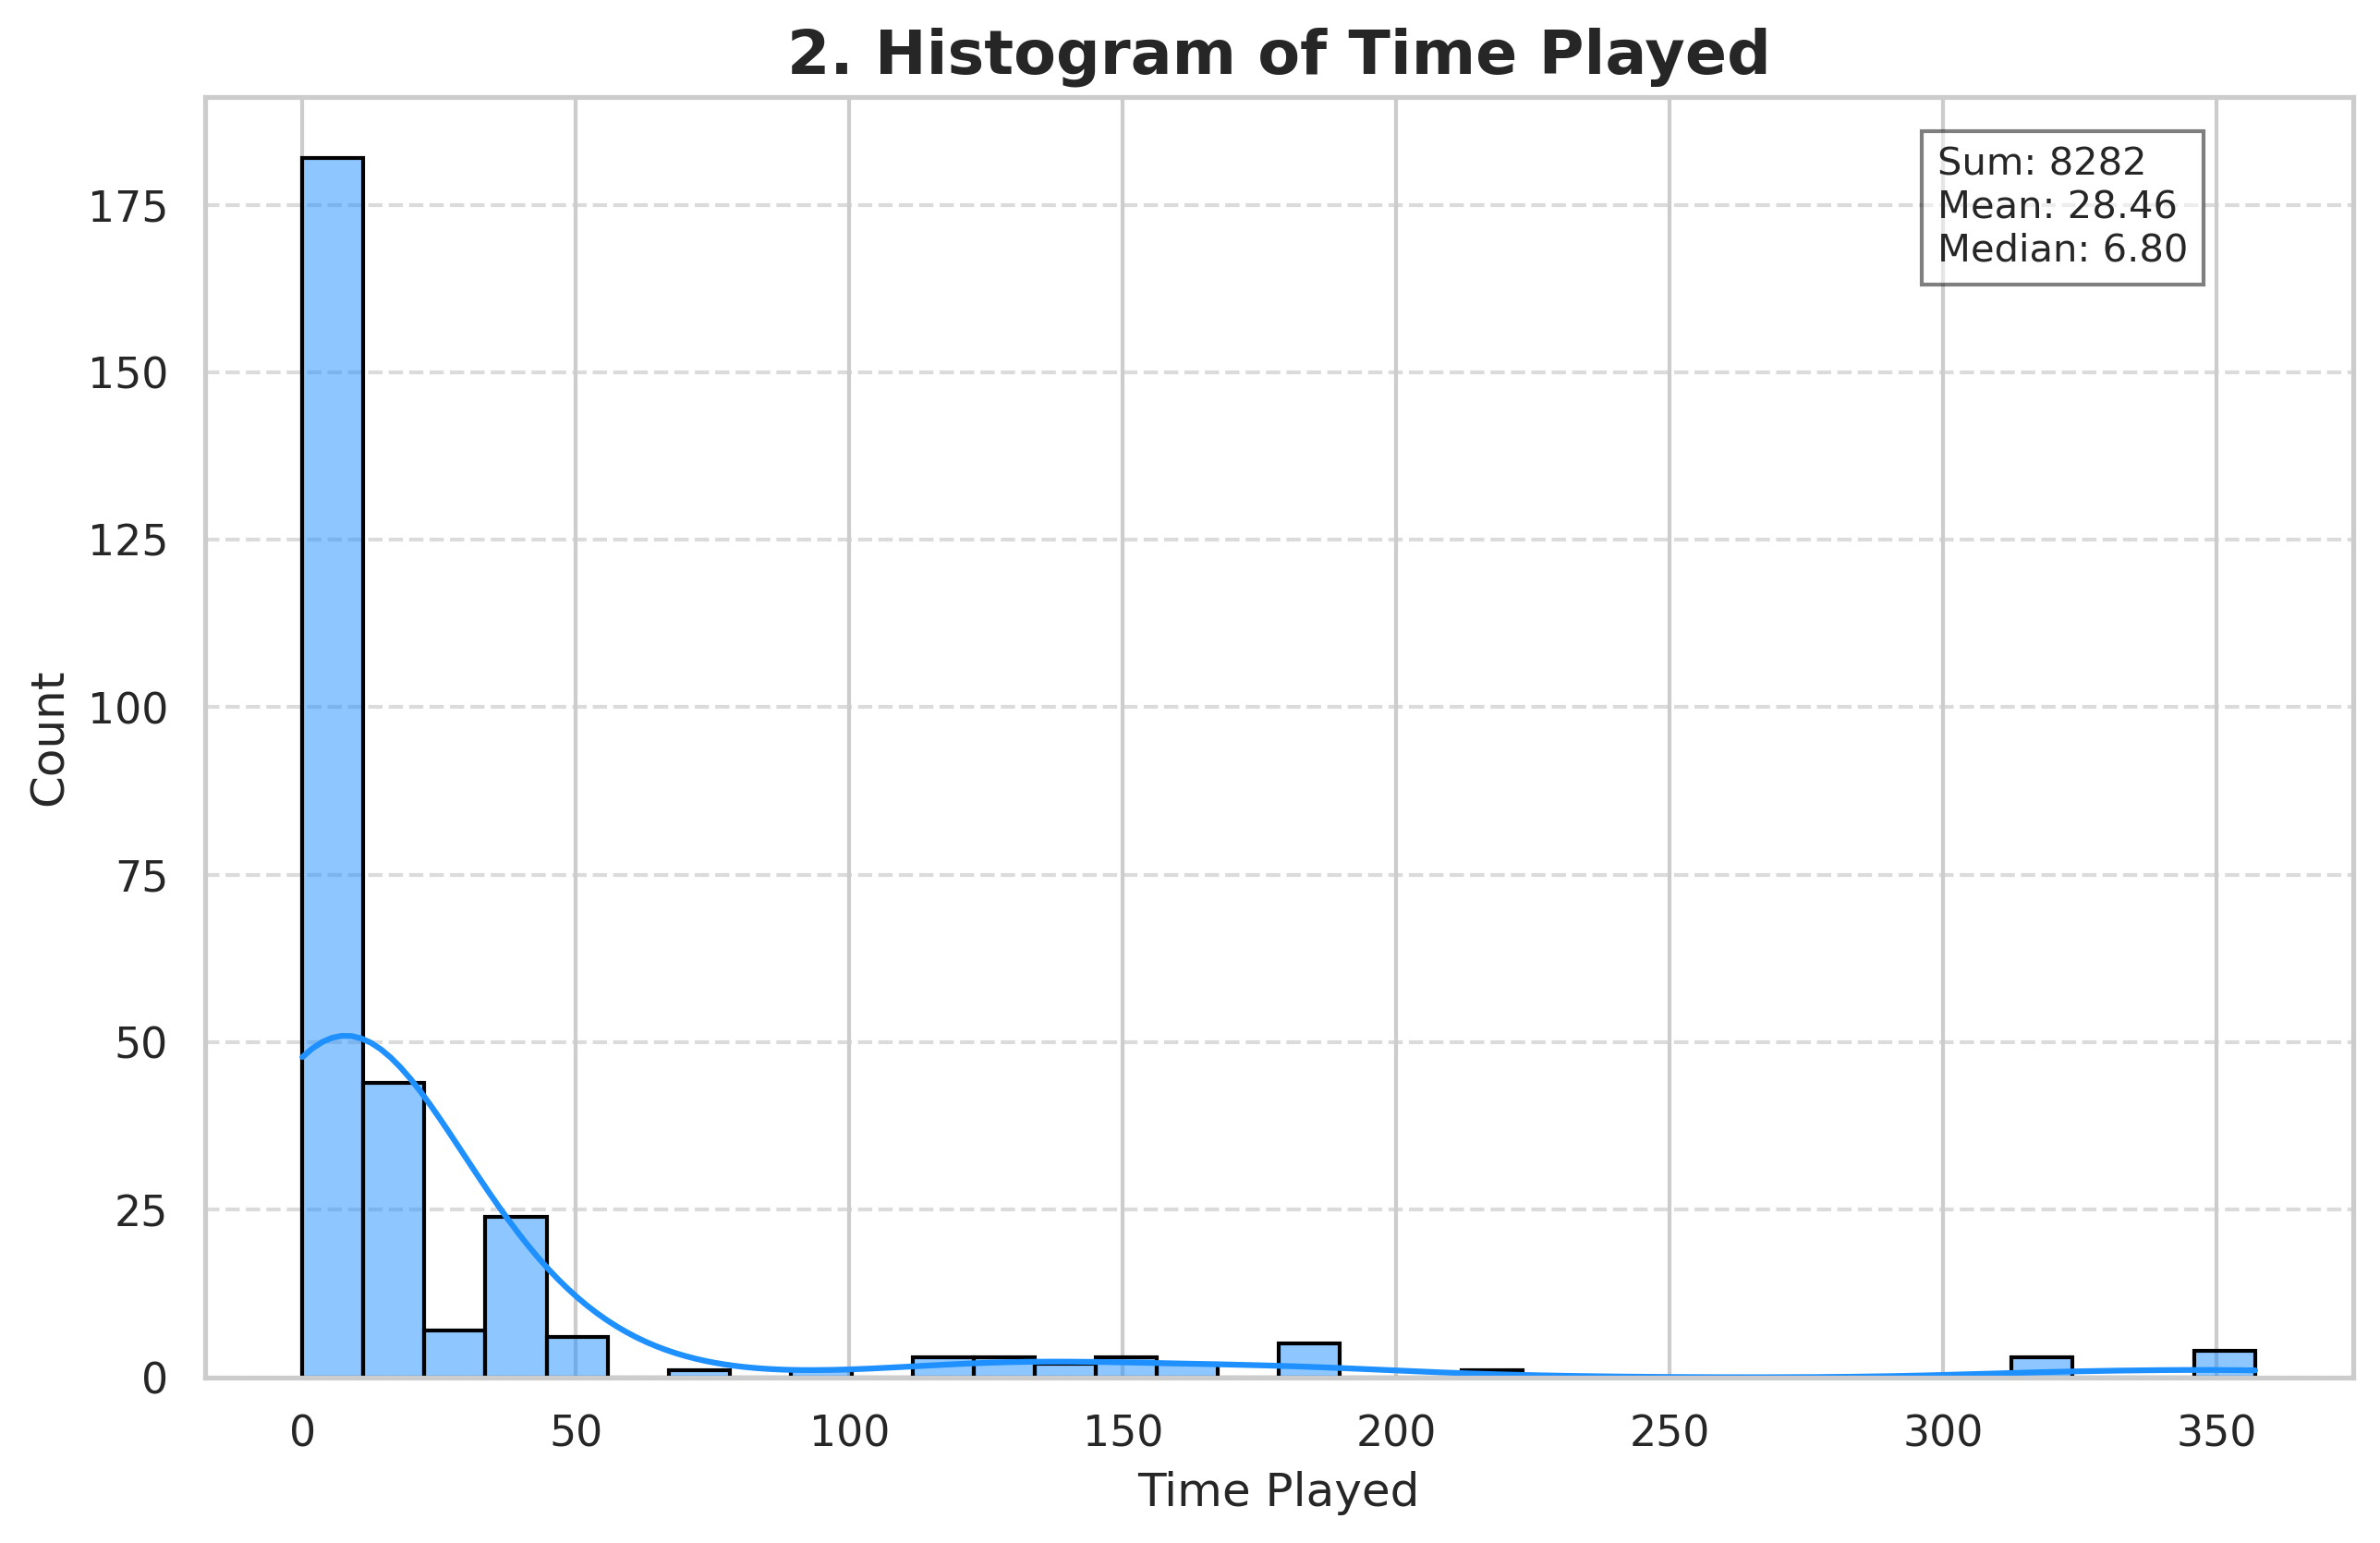
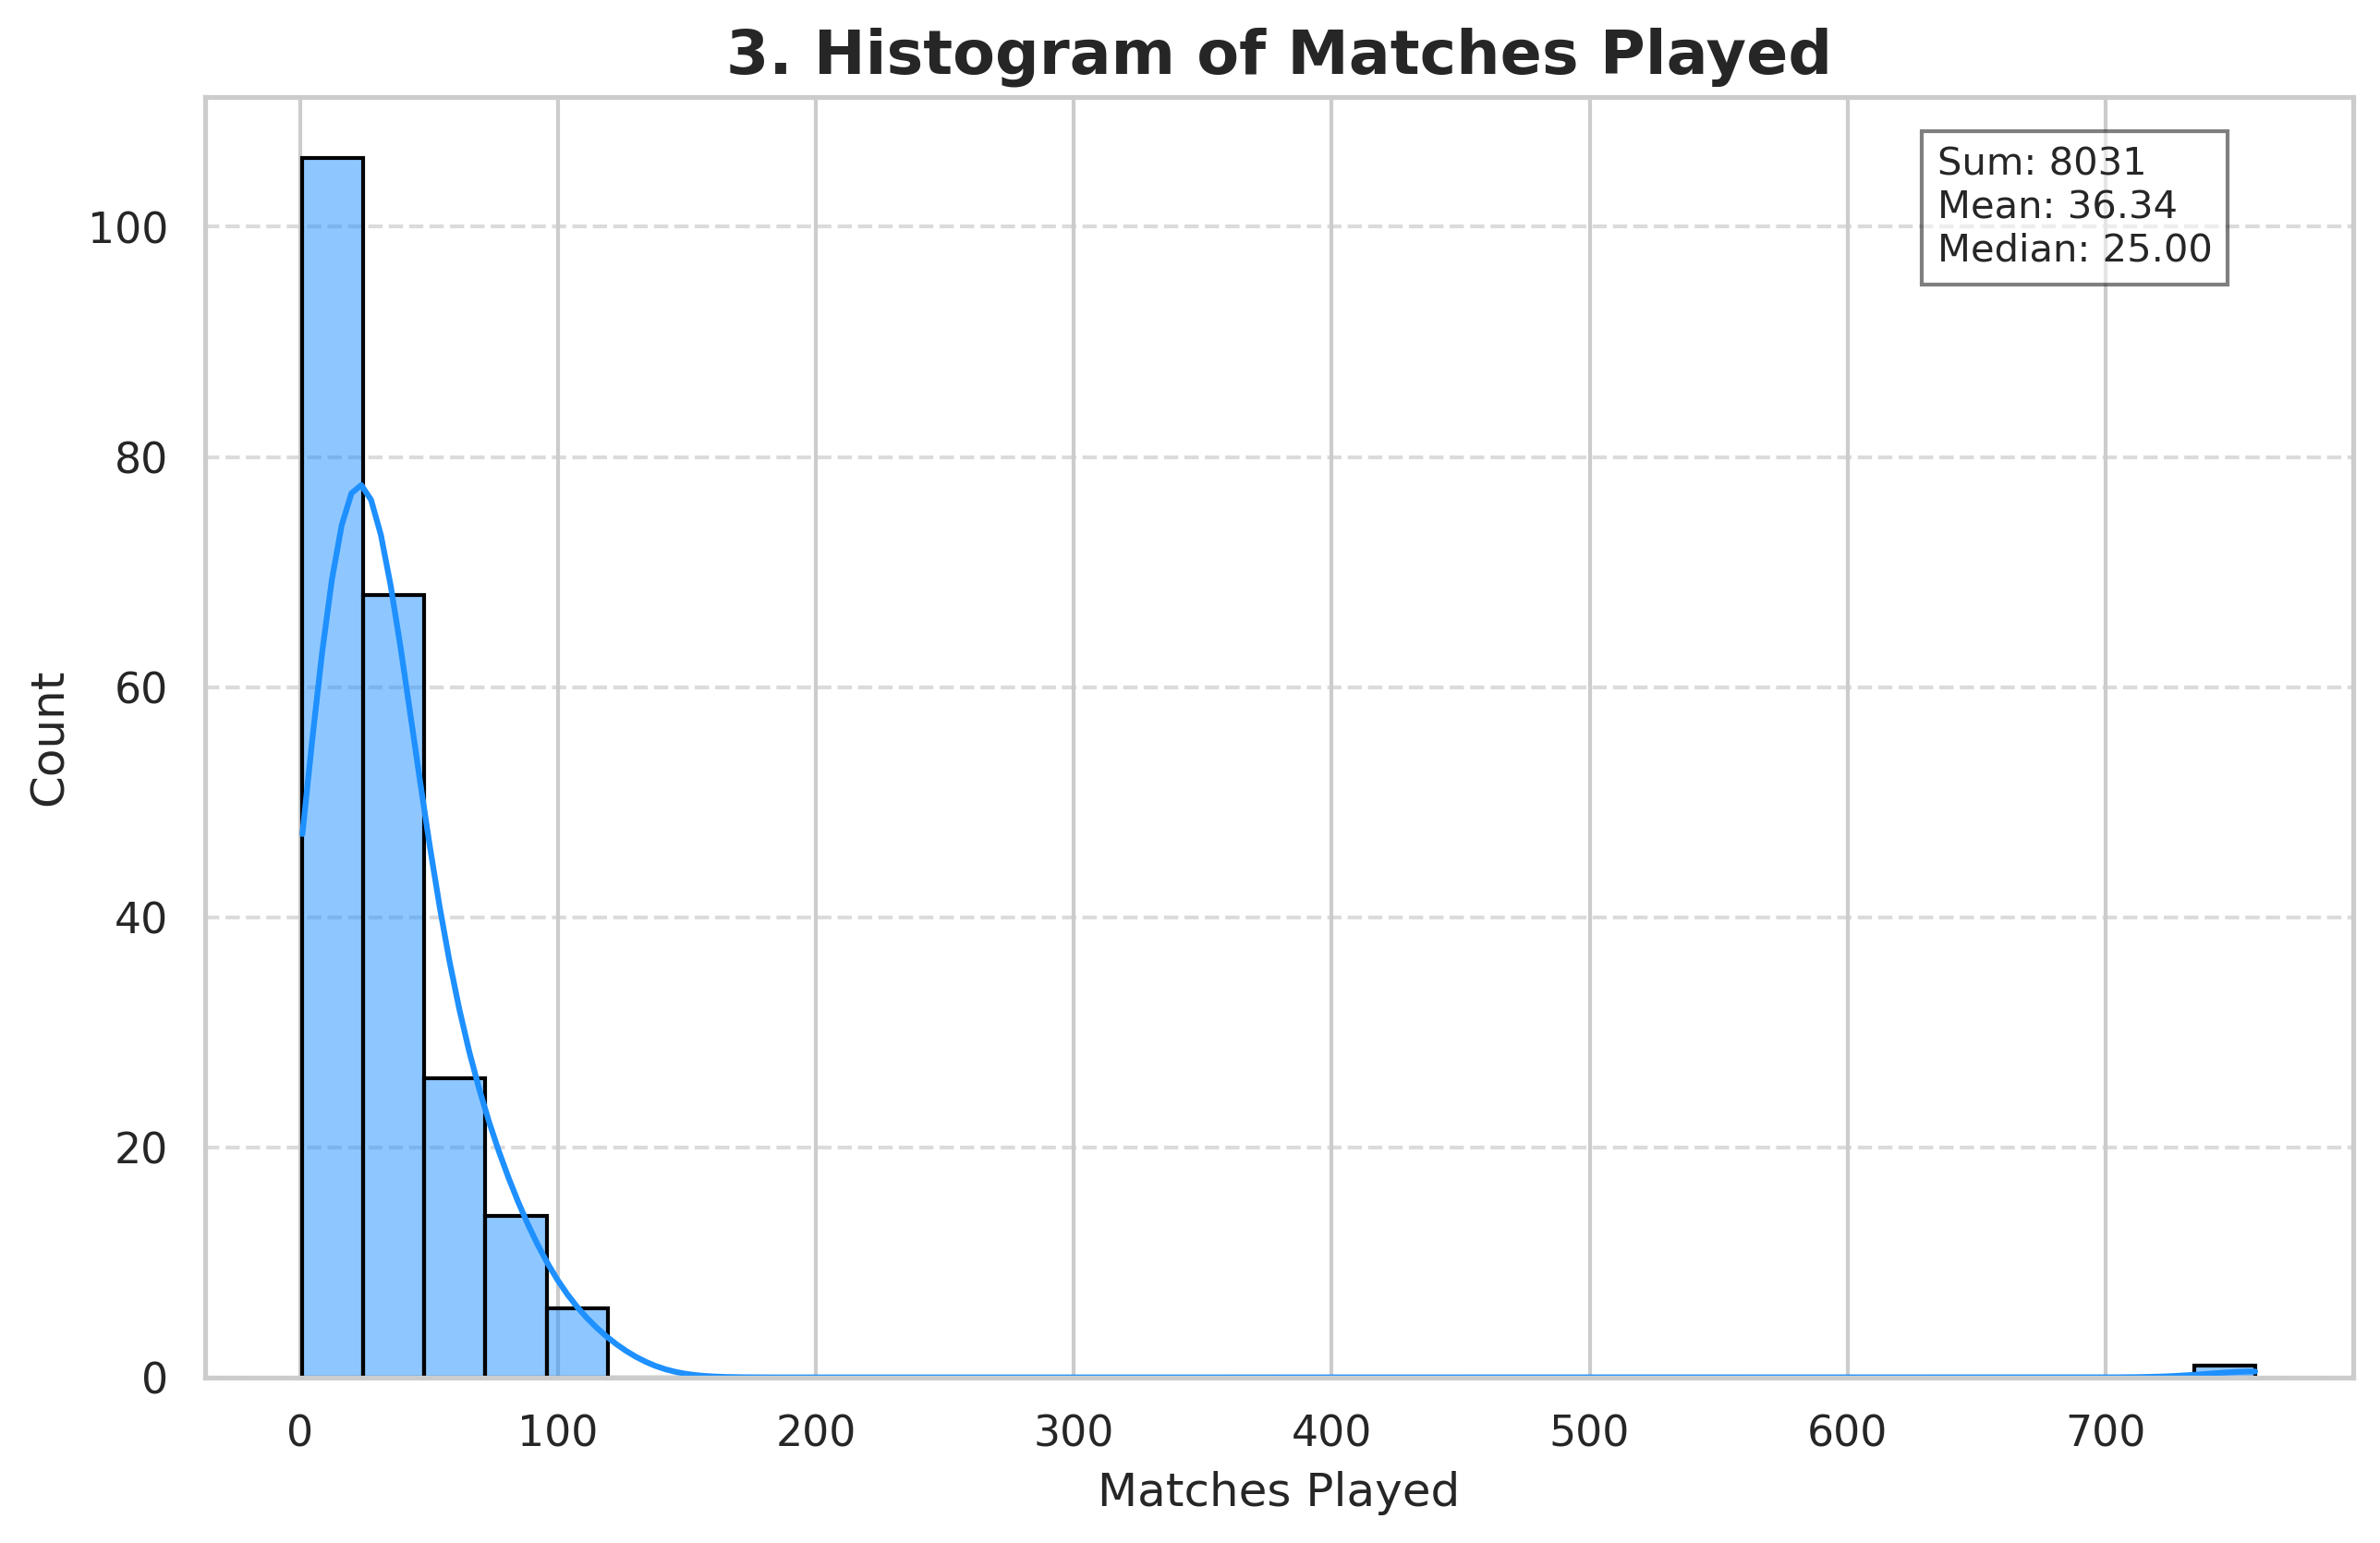
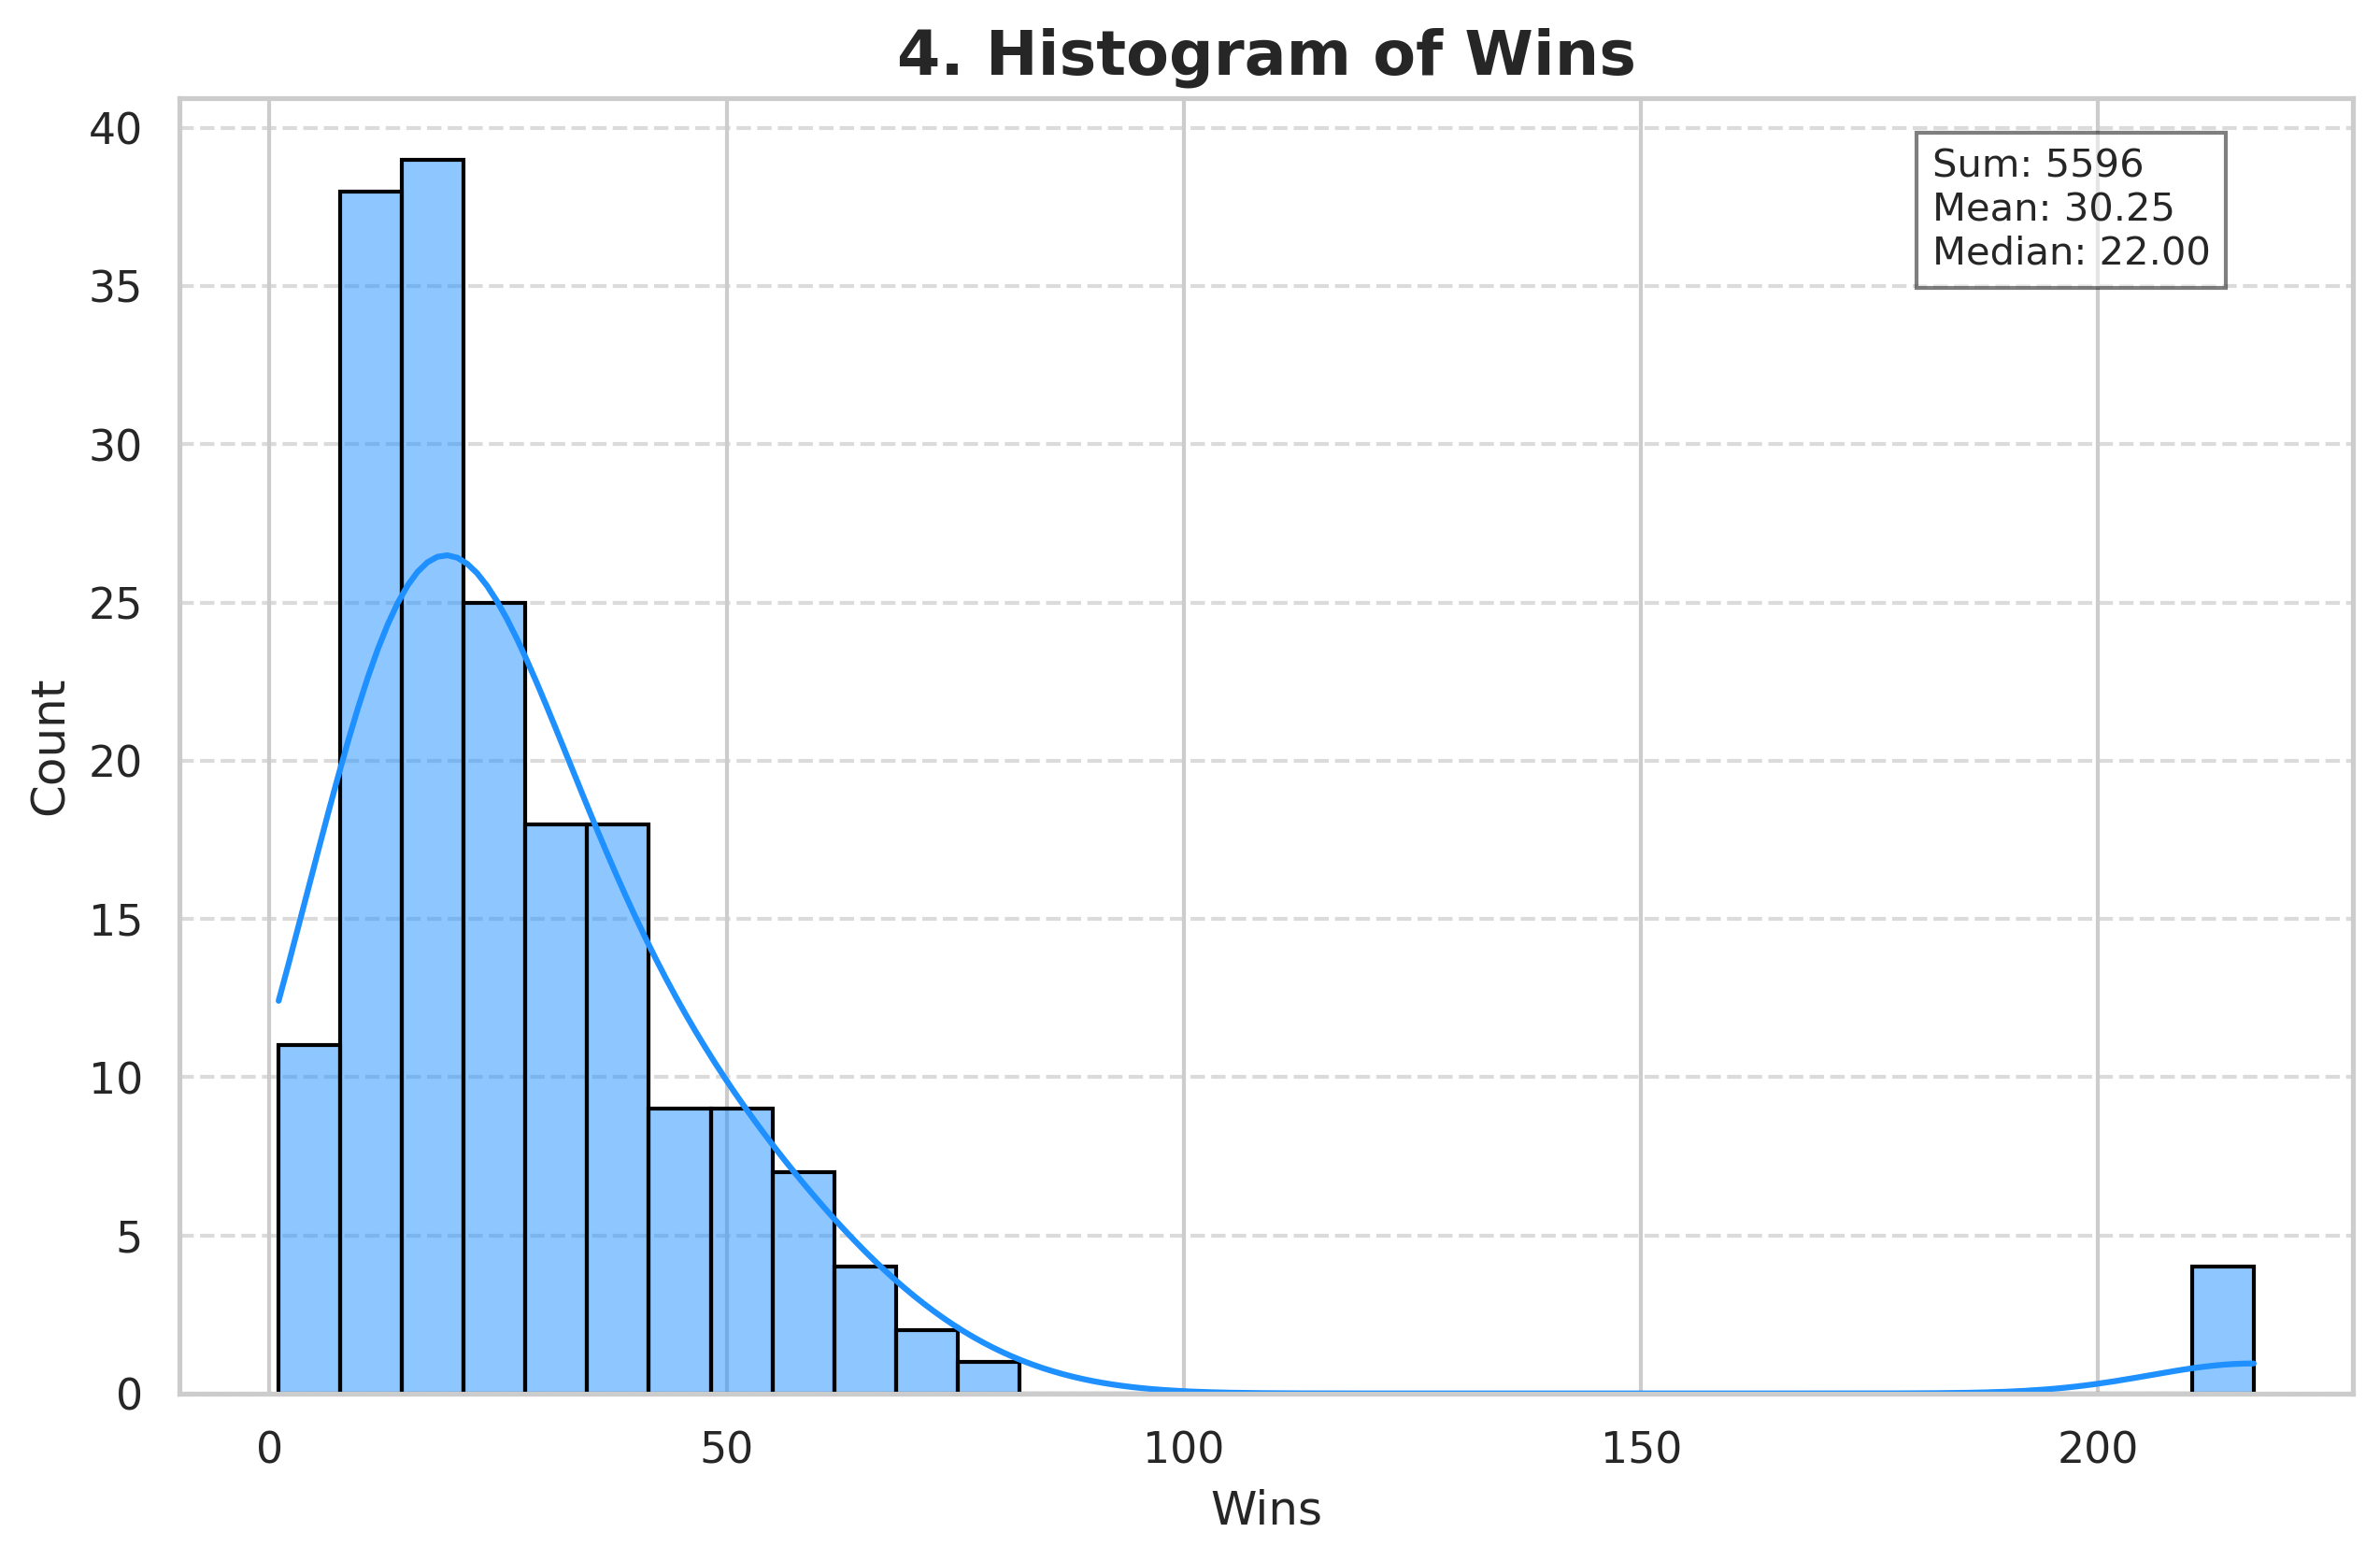
for i, column in columns[2:-1]:
plt.figure(figsize=(10, 6))
data_filtered = data[data[column] != -1][column].dropna()
sns.histplot(
data_filtered, bins=32, kde=True, color="dodgerblue", edgecolor="black"
)
plt.title(f"{i}. Histogram of {column}", fontsize=16, fontweight="bold")
plt.xlabel(column, fontsize=12)
plt.ylabel("Count", fontsize=12)
plt.grid(axis="y", linestyle="--", alpha=0.7)
total_sum = data_filtered.sum()
mean = data_filtered.mean()
median = data_filtered.median()
stats_text = f"Sum: {total_sum:.0f}\nMean: {mean:.2f}\nMedian: {median:.2f}"
plt.gcf().text(
0.75,
0.85,
stats_text,
fontsize=10,
bbox=dict(facecolor="white", alpha=0.5, edgecolor="black", linewidth=1),
ha="left",
va="top",
)
output_path = f"{output_directory}/{i}. {column}.png"
plt.savefig(output_path, bbox_inches="tight", dpi=300)
plt.close()
print(f"Saved plot to {output_path}")